| Issue |
Metall. Res. Technol.
Volume 116, Number 5, 2019
Inclusion cleanliness in the metallic alloys
|
|
|---|---|---|
| Article Number | 512 | |
| Number of page(s) | 10 | |
| DOI | https://doi.org/10.1051/metal/2019006 | |
| Published online | 09 August 2019 | |
Regular Article
Aggregation kernel of globular inclusions in local shear flow: application to aggregation in a gas-stirred ladle
Université de Lorraine, CNRS, IJL, Laboratory of Excellence DAMAS,
54000
Nancy, France
* e-mail: jean-pierre.bellot@univ-lorraine.fr
Received:
4
December
2018
Accepted:
7
March
2019
The control of metal cleanliness has always been a concern for metallurgists since inclusions directly influence the mechanical properties of alloys. In most metallurgical routes, a refining treatment of the liquid alloy is performed, in particular with the aim of improving the metal cleanliness that is achieved via a better control of particle contents and particle size. Since the efficiencies of inclusion removal mechanisms increase with inclusion size, the turbulent aggregation process plays a major role in all refining treatments. Interaction between particles such as aggregation is usually modelled through kinetics kernels which may be difficult to estimate. This paper contributes to express turbulent aggregation kernel taking into account the hydrodynamic effects at the inclusion scale. The numerical approach combines three numerical techniques, a Lattice Boltzmann Method to resolve the flow, an immersed boundary method for the particle-fluid interactions and a Lagrangian tracking for the motion of individual particles. Deterministic simulations of spherical particle pair trajectories leading to collision or avoidance allow us to calculate statistical kernels in a shear flow. The results show a strong influence of the short distance hydrodynamic effects on the collision kernel, particularly when the diameter ratio of the two interacting particles is far from unity. An application of this new aggregation kernel is applied to simulate the time evolution of the particle size distribution in a typical steel gas-stirred ladle.
Key words: Non-metallic inclusion / aggregation kernel / numerical simulation / liquid steel / population balance method
© M. Gisselbrecht et al., published by EDP Sciences, 2019
 This is an Open Access article distributed under the terms of the Creative Commons Attribution License (http://creativecommons.org/licenses/by/4.0/), which permits unrestricted use, distribution, and reproduction in any medium, provided the original work is properly cited.
1 Introduction
The large amount of non-metallic inclusions (NMI) present in the molten steel after the deoxidation process would have a detrimental impact on the mechanical properties of this steel. For this reason, ladle treatment of steels has long been described as the secondary metallurgical process mainly responsible for the control of NMI. As shown in Figure 1, an injection of argon through one or more porous plugs at the bottom of the ladle provides both aggregation of particles in the turbulent argon plume and the entrapment of the inclusions by the bubbles well known as the flotation mechanism. The physical phenomena involved in a gas-stirred ladle are numerous and complex owing to the three-dimensional and multiphase (metal-gas and inclusions) nature of the reactor. An accurate modelling of the huge number of interactions is necessary in order to obtain a good assessment of the evolution of the inclusion population during the treatment.
This is why numerous models, both experimental [1] and numerical [2,3], were developed for a better understanding of the mechanisms at play and their coupling. In most macroscale numerical simulations, flotation and aggregation mechanisms are modelled through the use of kinetics kernel. A population balance method (PBM [4,5]) for solid particles is then combined with computational fluid dynamics (CFD) for solving the multiphase flow [6,7]. Among them, a recent numerical simulation shows that aggregation plays the most significant role since the flotation rate increases with the particle size. The authors conclude that the inclusion removal in the gas-stirred ladle can be described as the aggregation of small particle sizes to larger aggregates which are finally removed by flotation [8]. For the hydrodynamic conditions prevailing in the liquid metal ladle and for the usual size of NMI (in the range between one micron and a few tens of microns), the aggregation is mainly induced by turbulence. Most authors apply the Saffman and Turner (ST) kernel [9] as the orthokinetic aggregation kernel assuming that inclusions have no inertia and that particle size is small compared to Kolmogorov’s length scale. If all these assumptions are well justified, the ST kernel does not take into account hydrodynamic effects at the inclusion scale nor long distance interaction forces between particles. Among the authors who have studied aggregation efficiency, Baldi and Vanni [10,11] can be considered as the leaders in this domain. They solved the trajectories of pairs of colloidal particles (or aggregates) accounting for both colloidal forces and hydrodynamic interaction in order to predict collision efficiencies. For instance in the case of strong electrostatic forces between polystyrene particles in water, the authors have calculated a collision efficiency much lower than unity yielding a slow aggregation. Other authors have studied aggregation of colloidal particles before Baldi and Vanni with the same ideas [12,13].
Aiming at improving aggregation kernels in the specific system of NMI in liquid metal, numerical simulations of particle pair collisions have been carried out at the scale of the inclusion. The evolution of numerical techniques allows us to simulate fully resolved inclusions when approaching each other during a collision event. Multiple simulations of deterministic collisions (or avoidances) make it possible to calculate statistical aggregation kernel as well as collision efficiency.
This paper is consequently organized as follows: the numerical methods implemented to simulate mesoscopic behaviour of immersed inclusions in shear flows are first described. Then, collision cross-sections, aggregation kernels and efficiencies for varying Reynolds numbers (based on shear rate) and diameter ratios are reported and discussed. Finally, a special focus on the evolution of a population of NMI in an industrial gas-stirred ladle is proposed.
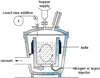 |
Fig. 1 Schematics of a steel gas-stirred ladle. |
2 Computational models and methods
The simulation of the two-phase flow (liquid metal and inclusion) fully couples solid and liquid phases using an immerged boundary method. Hence, the liquid metal flow is resolved at the inclusion scale and the hydrodynamic interaction is simulated. This numerical tool is applied to a collision or avoidance event.
2.1 Computational methods for collision simulations at inclusion scale
The simulation of fully-coupled solid and liquid phases involves three components: Lagrangian tracking updates velocity and position of particles over time, a lattice Boltzmann method resolves the liquid flow and an immersed boundary method ensures a full coupling between both phases.
2.1.1 Lagrangian particle tracking (LPT)
Inclusions are tracked individually, and their motion is calculated by solving Newton’s equations of motion for each them. Summing all forces and torques acting on each particle, their instantaneous acceleration (translation and rotation) is calculated with an explicit approach.
 (1)
(1)
Particle acceleration is integrated twice to get velocity and displacement. Angular acceleration is integrated to get rotation rate and orientation, the latter being represented in the form of a quaternion.
A more general description of the method can be found in [14].
2.1.2 Lattice-Boltzmann method (LBM)
The transient flow is solved using a lattice-Boltzmann method meaning that the flow quantities such as momentum are indirectly obtained from moments of distributions along a discrete set of velocities that join the nodes of a lattice. The method used in this current work is three-dimensional and uses a set of 18 discrete velocities (D3Q18). It uses Eggels and Somers’s collision operator [15] which is a multiple relaxation time method (MRT) that allows simulations to be accurate and stable over a wide range of conditions.
2.1.3 Immersed-boundary method (IBM)
The immersed boundary method used to resolve solid-liquid interaction is borrowed from [16]. It makes use of the LBM distributions to compute, with an explicit scheme, the amount of momentum to transfer from one phase to the other to ensure a no-slip condition at the surface. Surfaces of the solids are discretized with marker points at which flow properties are interpolated from the surrounding LBM nodes. Knowing the flow properties and the particle motion at each marker point, the force required to impose the solid velocity to the liquid phase is calculated at each marker point and then distributed back to the surrounding lattice nodes as a source term in the LBM. The total force and torque acting on each solid object are obtained by summing all the contributions from all the marker points and are applied as force and torque in the LPT.
2.2 Simulation setup: collision in a plane shear flow
Since primary inclusions remain small compared to turbulence length scales, the turbulence induced shear flow has been approximated with a constant plane shear flow at the length and time scales of inclusion interaction events.
2.2.1 Modelling of turbulence at inclusion scale
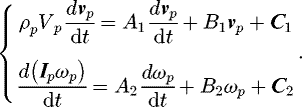
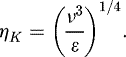
Aggregation in liquid metal treatment ladle is driven by the turbulence-induced shear. Turbulence itself is provided by bubble swarms in gas plumes due to gas injection at the bottom of the steel ladle. The turbulence characteristics in steel treatment processes have been described in the literature [6]. Figure 2 shows the typical turbulence dissipation rates (∊) calculated in process scale simulations. The corresponding shear rates ( ) and size of the smallest eddies (ηK) are derived from the energy dissipation rates (∊) and the kinematic viscosities of liquid metals, using Kolmogorov’s theory:
 (2)
(2)
 (3)
(3)
Considering refining processes of liquid steel, Figure 2 shows that particles around 10 μm in diameter (e.g. alumina or calcium aluminate primary inclusions in molten steel [17]) remain small compared to the smallest turbulent eddies. It has thus been assumed that the local shear seen by interacting inclusions could be estimated with a linear approximation, that is a plane shear flow, with a shear rate ( ) scaled according to turbulence properties.
Since turbulence has been modelled by a steady plane shear flow when considering inclusion collisions, finally the numerical investigations consist in studying trajectories of inclusion pairs in a plane shear flow and determining the outcome of their interaction (collision or avoidance) depending on their relative initial positions.
 |
Fig. 2 Typical scales encountered during flotation process. |
2.2.2 Boundary and initial conditions
To control the shear rate in the whole domain, constant shear stresses with opposed signs have been imposed in the top and bottom surfaces (Fig. 3). Such a stress boundary condition is obtained by combining a free-slip boundary condition with a source term. Alone, the free-slip condition would ensure no normal velocity and no tangential stress. Here, a tangential stress is added. The corresponding shear rate is equal to the shear stress divided by the dynamic viscosity of the liquid metal. Periodic boundary conditions are imposed on the other surfaces.
Two spherical particles are initially positioned far enough from each other so that they do not see each other’s disturbance of the plan shear flow. The flow around each particle is initialized with the analytical solution in Stokes’ conditions [18,19]. Until particles start to see each other’s disturbance of the flow, their velocity is equal to the plane shear velocity profile at their centre of mass, and their angular velocity equal half of the plane shear vorticity, that is  . All boundary and initial conditions are illustrated in Figure 3.
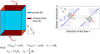 |
Fig. 3 Boundary and initial conditions applied for the direct numerical simulation of a collision event. |
3 Determination of collision sections and aggregation kernels
These simulation methods and set-up have been used to track spherical particle pairs in a plane shear flow, from which collision cross sections are determined. Such cross-sections provide a way to calculate aggregation kernels and efficiencies. Aggregation kinetics has thus been quantified for various Reynolds numbers and particle size ratios. Since strong cohesive forces due to the non-wetting of the NMI lead to strong bonds through the formation of gas bridges as highlighted by [20–22]. Hence, it has been assumed that particles remain stuck together once they have collided, thereby assimilating collision to aggregation.
3.1 Aggregation kernel and efficiency: definition
The so-called aggregation kernel is a statistical representation of aggregation kinetics that appears in the population balance equation. As an example, if a particle size distribution of inclusions is discretized into M classes where Ni is the number of inclusions of class “i” – diameter of the particle lying between dpi and dpi+1 –per unit volume of liquid metal, then the expression of the aggregation frequency between two inclusion classes i and j is given by:
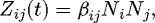 (4)
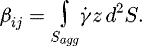
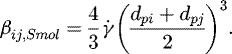
where βij is the aggregation kernel between classes i and j. It is defined as the volume flux of particles that aggregate. By assimilating collision and aggregation in the particular case of NMI, this is the flux of particles flowing through collision cross-section, hence noted Sagg, illustrated in Figure 4. Aggregation occurs when the relative initial positions of the interacting particles fall inside this surface. Hydrodynamic interactions between particles shape this surface and modify its area, and will consequently have an impact on the aggregation kernel. In the specific case of particles transported in a plane shear flow, with z being the shear direction, particle velocities before interaction are equal to the shear velocity profile, hence their flux can be calculated which yields:
(4)
where βij is the aggregation kernel between classes i and j. It is defined as the volume flux of particles that aggregate. By assimilating collision and aggregation in the particular case of NMI, this is the flux of particles flowing through collision cross-section, hence noted Sagg, illustrated in Figure 4. Aggregation occurs when the relative initial positions of the interacting particles fall inside this surface. Hydrodynamic interactions between particles shape this surface and modify its area, and will consequently have an impact on the aggregation kernel. In the specific case of particles transported in a plane shear flow, with z being the shear direction, particle velocities before interaction are equal to the shear velocity profile, hence their flux can be calculated which yields:
 (5)
(5)
Neglecting hydrodynamic interactions, inclusion trajectories follow rectilinear paths and the aggregation surface Sagg is a disk with a diameter dpi + dpj. It leads to the so-called Smoluchowski’s kernel [23]:
 (6)
(6)
Smolukowski’s collision kernel is very similar to Saffman and Turner’s kernel, that is derived from turbulence statistics instead of a plane shear [11]:
 (6)
(6)
Smoluchowski’s and Saffman and Turner’s kernels are pretty much equivalent in regard to equation (2), which supports the modelling of turbulence at inclusions scale described in Section 2.2.1.
Collision efficiency between particles i and j, denoted αij can then be defined as the ratio between the effective collision kernel and a reference that does not account for hydrodynamic interactions between particles as:
 (7)
(7)
Collision efficiency then quantifies the impact of hydrodynamics on the aggregation kernel.
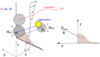 |
Fig. 4 Schematic of collision surface between 2 spherical inclusions in driven shear flow providing aggregation kernel. It can be reduced to a quarter cross-section for symmetrical reason. |
3.2 Optimizing calculation: picking method
Collision cross-sections have been determined following an iterative process by identifying sets of relative initial positions leading to collision and to avoidance, as illustrated in Figure 5. In order to optimize the calculation of such a surface, a method was developed to suitably pick the points to be simulated. It is illustrated on Figure 5, in which empty circles marking avoidance and black dots mark collision outcome of the simulation corresponding to each initial relative positions between the particle pair. An iterative subdivision is performed, in order to run simulations for conditions near the cross-section boundary, thus optimizing its calculation relatively to number of required simulations.
The method works as follows: the surface covering the initial relative positions between the particles is tessellated in triangles, the edges of which join all known points. Iteratively, the longest edge of all triangles that contains both collision and avoidance outcomes is divided in two segments (and the two triangles it belongs to are also split in two). The newly created vertex defines the relative position between the particles in the next simulation. Once this simulation has run, the triangle subdivision process is repeated to pick the next simulation conditions, until the precision of the cross section is considered good enough.
As an example, in Figure 5, the actual collision cross-section lies between the dark grey area, made of triangles with only collision edges, and the total grey area, made of all triangles that contain at least one collision edge. In Figure 5, the Smoluchowski’s cross-section is represented as well.
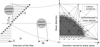 |
Fig. 5 Simulation setup and cross-section derivation from 115 simulations of 2 identical particles at |
3.3 List of parameters
All the physical input parameters of the numerical experiments are reported in Table 1a. Three independent dimensionless parameters are extracted and gathered in Table 1b. Particle inertia is negligible (the Stokes number is kept much smaller than 1), only the size ratio between interacting inclusions and the shear Reynolds number have been varied.
Long distance forces between inclusions were not considered, and as such Table 1a and 1b only lists parameters related to hydrodynamic forces, because it is assumed that they prevail over other interactions, as highlighted for example in [22].
Input parameters for the numerical experiment.
Corresponding dimensionless independent parameters.
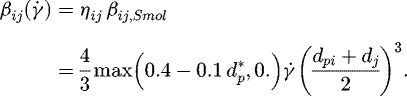
3.4 Results: Aggregation efficiency
Table 2 reports aggregation efficiency αij as a function of shear Reynolds number and particle size ratio. Table 3 presents the conversion between the local shear rate and the Reynolds number for an example inclusion of 10 μm in liquid steel. The shear rate range covered by the simulations spreads well over the one found in steel gas-stirred ladles (Fig. 2).
Table 2 clearly emphasizes that efficiency is far less than unity, meaning that hydrodynamic effects cannot be neglected in hydrodynamic conditions prevailing in flotation processes. This was expected looking at the effective collision surface represented in the example of the Figure 5 where the area is much smaller than Smoluchowski’s. However, there are no significant variations of the efficiency with the shear Reynolds number. On the other hand, the efficiency strongly depends on particle size ratios. Thus, as a first approximation, aggregation efficiency can be assumed to vary only with particle size ratio. A simple correlation is then proposed:
 (8)
(8)
Binary aggregation efficiencies as a function of shear Reynolds number and inclusion size ratio (best guess value in bold).
Shear rate as a function of shear Reynolds number according to a 10-μm inclusion in liquid steel.
4 Application: particle size distribution in representative conditions of a gas-stirred ladle
This correlation of aggregation efficiency is applied to assess the aggregation rate in a full scale 60 t steel ladle. In the following development, a global 0D population balance method addresses the time evolution of the inclusion size distribution.
4.1 The population balance equation
A theoretical treatment of turbulent aggregation was initially carried out by Smoluchowski [4] who derived a population balance equation (PBE) in the case of pure aggregation without any breakage of the aggregates. The so-called Smoluchowski’s equation can be expressed in its discretized form as:
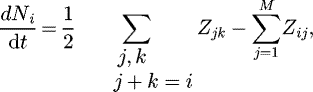 (9)
where the first positive term on the right-hand side represents the rate of formation of particle i by aggregation of smaller particles and the second negative term the rate of disappearance due to aggregation of particle i with others.
(9)
where the first positive term on the right-hand side represents the rate of formation of particle i by aggregation of smaller particles and the second negative term the rate of disappearance due to aggregation of particle i with others.
This PBE is integrated over the whole volume Vlad of the ladle leading to the 0D PBE:
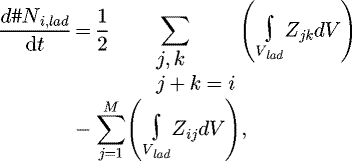 (10)
(10)
#Ni,lad is the total number of inclusion of size i expressed as:
 (11)
(11)
The PBE (Eq. (10)) is solved applying the cell average technique [24] which is a variant of the fixed pivot method initially developed by Kumar and Ramkrishna [25].
As seen in equation (4), the collision frequency Zij is proportional to the collision kernel βij highlighting the significance of the present work.
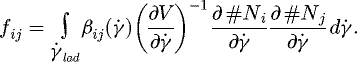
4.2 Deriving the aggregation frequency
If we now introduce the global aggregation frequency fij obtained by integration of Zij over the whole volume of the ladle:
 (12)
(12)
and substituting for Zij from equation (4),
 (13)
(13)
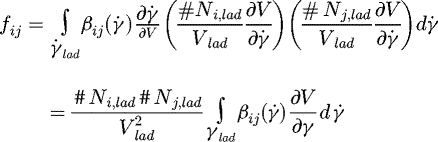
Equation (13) is not an easy-to-use expression as collision kernel is given according the shear rate. Thus, it has to be restructured changing integration domain over shear rate spectrum. To this purpose, the integration is achieved over the volume seen as a cumulative distribution function according to the considered shear rate  :
:
 (14)
(14)
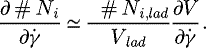
Equation (14) can be then used to express the number density of particles:
 (15)
(15)
Finally, injecting expression (15) to (13) and achieving integration by substitution from the volume to the shear rate enables to give a shear based expression of the aggregation frequency:
 (16)
(16)
According to equation (16), the following data are required for estimating the global aggregation frequency fij:
-
the collision kernel βij as a function of the shear rate ;
-
the shear distribution in volume (
 ) ;
) ; -
the shear rate distribution seen by each particles (
 ).
).
The first data are provided by the present work through equations (7) and (8):
 (17)
(17)
The second and third data can be obtained by macroscale simulations.
4.3 Results for an industrial ladle
The calculation of the aggregation frequency is applied to a full scale 60 t steel ladle. Argon is injected through two porous plugs, located at the base of the ladle with a gas flow rate equal to 63 NL.s−1. The two-phase flow turbulent bubble-liquid metal was simulated for the 3D geometry of the ladle using a finite volume method. Details of the simulation are found in [6]. Gas retention as well as the turbulent dissipation rates over a vertical plan crossing the ladle are displayed in Figure 6. It is shown that turbulent regions are mainly located in the bubble plumes, with a dissipation rate of the turbulent kinetic energy varying in the range between 10−2 and 1 m2.s−3. The two bubble swarms provide a good stirring of the steel bath [6] and therefore at a first approximation it is possible to assume a homogeneous inclusion population in the ladle.
With this assumption, the distribution of the inclusion number with shear rate spectrum can be simplified as:
 (18)
(18)
From equation (16), the expression of aggregation frequency given in equation (16) can be then rewritten as:
 (19)
(19)
The PBE (Eq. (10)) is then solved according this expression of fij, where the aggregation kernel is given by equation (17) and the shear rate spectrum is provided by the CFD simulation.
According to the turbulent flow in the ladle the distributions and their cumulatives of  function as well as
  function at given particle sizes are displayed in Figure 7. The left-hand side of this figure reveals that the main part of the steel bath remains weakly turbulent (
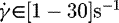 ). It corresponds to the domain outside the plumes. On the contrary, the shear rate values can reach few tens of s−1 in the two plume regions. When this distribution is weighed by the aggregation kernel the distribution of
  , shown on the right-hand side of the Figure 7, extends to higher value of
  because the aggregation kernel linearly increases with
  (Eq. (17)). The strong dependence of the aggregation efficiency αij (and so βij) with the inclusion size ratio is well noticeable on Figure 7. The cumulative of
  over the shear rate spectrum in the ladle let us figure out the important effect of the size ratio on the values of the aggregation frequency fij.
The PBE (Eq. (10)) has then been solved for pure aggregation during 10 min of stirring in the steel ladle. Two test cases have been compared: a first with an aggregation efficiency αij constant and equal to unity (Smoluchowski’s collision kernel) and a second with the hydrodynamic collision efficiency (given by the correlation 8). As an initial particle size distribution (PSD), a log-normal distribution is applied (see Fig. 8 in white) with a total mass content equal to 0,176 kg/m3 corresponding to 7,9 ppm of Total Oxygen (TO) content − assuming a population of calcium aluminate inclusions. The PSD has been discretized into 20 sized classes with lower and upper boundaries equal respectively to 2 μm up and 100 μm.
The results emphasize that the aggregation mechanism translates the PSD toward the large size, i.e., larger size particles appear during treatment due to the aggregation of smaller size particles (their number decreases with time). It is noteworthy that PSD does not evolve on the same way comparing Schmolukowski’s kernel (efficiency αij = 1 in blue) and the effective aggregation kernel (in red) as expected. In the first case, the PSD evolves faster than in the second, thereby leading to a more significant increase of mean inclusion diameter. On a more quantitative way, the total number of aggregations per unit of time is displayed in Figure 8. Taking an aggregation efficiency equals to unity leads to a significant increase of this value compared to the efficiency correlation. This is especially true at the start of the aggregation process where the inclusions are numerous. The aggregation occurrences then decrease over process time, with a more significant drop for α = 1. This can be explained by the fact that all classes of inclusions may collide and aggregate in Smolukowski’s case. This is no longer true when hydrodynamic interactions lead to avoidance for size ratio larger than 4.
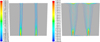 |
Fig. 6 Isocontours of gas retention and turbulent dissipation rates in metallic liquid bath obtained by 3D macroscale simulations [6]. |
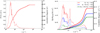 |
Fig. 7 Log-scale distributions in a 60t gas-stirred ladle: liquid volume in shear spectrum (left), and corresponding distributions weighted by collision kernel for different particle size ratios (right). |
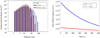 |
Fig. 8 Comparison of two test cases with (in red) and without hydrodynamic collision efficiency (in blue). Initial and after 10 min of stirring PSD (left-hand size), total collision frequency versus time (right-hand size). |
5 Conclusions
Numerical experiments of collisions of inclusions in a pure shear flow have been addressed thank to the coupling of Lattice Boltzmann and Immersed Boundary methods. These direct numerical simulations solve the molten metal field at the inclusion scale and account for the hydrodynamic interactions between the two approaching particles. We found that for small inclusions (in the typical range between 1 and 10 microns) in turbulent metal flow (encountered in refining processes), the mutual hydrodynamic effects are not negligible and limit the aggregation occurrences, so the aggregation efficiency. This is especially true when the inclusion size ratio is far from unity. A simple correlation of the aggregation kernel in turbulent shear flow has been formulated.
This new aggregation kernel has been applied to the macroscale simulation of aggregation in a steel gas-stirred ladle. The aggregation frequency of two sized classes of inclusions in the ladle fij has been derivated and expressed as a function of three contributions: the collision kernel, the space distribution of the shear rate and the shear rate distribution seen by each particle. The solution of the PBE allows us to predict the size evolution of the inclusion population for the turbulent conditions prevailing in an industrial ladle. It clearly shows that the hydrodynamic interaction at the inclusion scale significantly reduces the collision frequencies and must be taken into account.
Nomenclature
Greek letters
β: aggregation kernel [m3.s−1]

η: turbulent length scales [m]
∊: turbulent dissipation rate [m2.s−3]
Latin letters
A, B, C: force coefficient in LPT
x, y, z: cartesian coordinates [m]
Z: density of aggregation frequency [m−3.s−1]
Subscripts
Smol: relative to Smoluchowski
Superscripts
Compound
 :
shear-based Reynolds number []
:
shear-based Reynolds number []
References
- K. Higashitani, R. Ogawa, G. Hosokawa, Y. Matsuno, kinetic theory of shear coagulation for particles in a viscous fluid, J. Chem. Eng. Jpn. 15(14), 299–304 (1982) [CrossRef] [Google Scholar]
- C.G. Méndez, N. Nigro, A. Cardona, Drag and non-drag force influences in numerical simulations of metallurgical ladles, J. Mater. Process. Technol. 160(13), 296–305 (2005) [CrossRef] [Google Scholar]
- Y. Xie, S. Orsten, F. Oeters, Behaviour of bubbles at gas blowing into liquid wood’s metal, ISIJ Int. 32(11), 66–75 (1992) [CrossRef] [Google Scholar]
- M.V. Smoluchowski, Versuch einer mathematischen Theorie der Koagulationskinetik kolloider Lösungen, Zeitschrift für Physikalische Chemie 92U(11), 129–168 (1918) [Google Scholar]
- C. Coufort, D. Bouyer, A. Liné, B. Haut, Modelling of flocculation using a population balance equation, Chem. Eng. Process Process Intensification 46(112), 1264–1273 (2007) [CrossRef] [Google Scholar]
- I.L.A. Daoud, N. Rimbert, A. Jardy, B. Oesterlé, S. Hans, J.-P. Bellot, 3D modeling of the aggregation of oxide inclusions in a liquid steel ladle: two numerical approaches, Adv. Eng. Mater. 13(17), 543–549 (2011) [Google Scholar]
- V. De Felice, I.L.A. Daoud, B. Dussoubs, A. Jardy, J.-P. Bellot, Numerical modelling of inclusion behaviour in a gas-stirred ladle, ISIJ Int. 52(17), 1274–1281 (2012) [Google Scholar]
- J.-P. Bellot, J.-S. Kroll-Rabotin, M. Gisselbrecht, M. Joishi, A. Saxena, S. Sanders, toward better control of inclusion cleanliness in a gas stirred ladle using multiscale numerical modeling, Materials 11(17), 1179 (2018) [CrossRef] [Google Scholar]
- P.G. Saffman, J.S. Turner, On the collision of drops in turbulent clouds, J. Fluid Mech. 1(11), 16–30 (1956) [Google Scholar]
- M. Vanni, G. Baldi, Coagulation efficiency of colloidal particles in shear flow, Adv. Colloid Interface Sci. 97(1-3), 151–177 (2002) [CrossRef] [PubMed] [Google Scholar]
- G. Frungieri, M. Vanni, Shear-induced aggregation of colloidal particles: a comparison between two different approaches to the modelling of colloidal interactions, Can. J. Chem. Eng. 95(9), 1768–1780 (2017) [Google Scholar]
- G.R. Zeichner, W.R. Schowalter, Use of trajectory analysis to study stability of colloidal dispersions in flow fields, AIChE J. 23(3), 243–254 (1977) [Google Scholar]
- G.R. Zeichner, W.R. Schowalter, Effects of hydrodynamic and colloidal forces on the coagulation of dispersions, J. Colloid Interface Sci. 71(2), 237–253 (1979) [Google Scholar]
- A. Saxena, J.-S. Kroll-Rabotin, R.S. Sanders, A numerical approach to model aggregate restructuring in shear flow using DEM in Lattice-Boltzmann simulations, SINTEF Academic Press, Trondheim, Norway, 2017 [Google Scholar]
- J.G.M. Eggels, J.A. Somers, Numerical simulation of free convective flow using the lattice-Boltzmann scheme, Int. J. Heat Fluid Flow 16(15), 357–364 (1995) [Google Scholar]
- X.D. Niu, C. Shu, Y.T. Chew, Y. Peng, A momentum exchange-based immersed boundary-lattice Boltzmann method for simulating incompressible viscous flows, Phys. Lett. A 354(13), 173–182 (2006) [Google Scholar]
- E.-I. Castro-Cedeño, M. Herrera-Trejo, M. Castro-Román, Evaluation of steel cleanliness in a steel deoxidized using Al, Met. Mat. Trans. B 47(13), 1613–1625 (2016) [CrossRef] [Google Scholar]
- D.R. Mikulencak, J.F. Morris, Stationary shear flow around fixed and free bodies at finite Reynolds number, J. Fluid Mech. 56(12), 215–242 (2004) [Google Scholar]
- S. Lomholt, M.R. Maxey, Force-coupling method for particulate two-phase flow: stokes flow, J. Comput. Phys. 184(12), 381–405 (2003) [Google Scholar]
- M. Cournil, F. Gruy, P. Gardin, H. Saint-Raymond, Modelling of solid particle aggregation dynamics in non-wetting liquid medium, Chem. Eng. Process Process Intensification 46(112), 586–597 (2006) [CrossRef] [Google Scholar]
- K. Sasai, direct measurement of agglomeration force exerted between alumina particles in molten steel, ISIJ Int. 54(112), 2780–2789 (2014) [CrossRef] [Google Scholar]
- K. Sasai, Interaction between alumina inclusions in molten steel due to cavity bridge force, ISIJ Int. 56(16), 1013–1022 (2016) [CrossRef] [Google Scholar]
- M. Smoluchowski, Drei Vorträge über Diffusion, Brownsche Molekularbewegung und Koagulation von Kolloidteilchen, Zeitschrift für Physik 17, 557–585 (1916) [Google Scholar]
- J. Kumar, M. Peglow, G. Warnecke, S. Heinrich, L. Mörl, Improved accuracy and convergence of discretized population balance for aggregation: the cell average technique, Chem. Eng. Sci. 61, 3327–3342 (2006) [Google Scholar]
- S. Kumar, D. Ramkrishna, On the solution of population balance equations by discretization — I. A fixed pivot technique, Chem. Eng. Sci. 51(18), 1311–1332 (1996) [Google Scholar]
Cite this article as: Matthieu Gisselbrecht, Jean-Sébastien Kroll-Rabotin, Jean-Pierre Bellot, Aggregation kernel of globular inclusions in local shear flow: application to aggregation in a gas-stirred ladle, Metall. Res. Technol. 116, 512 (2019)
All Tables
Binary aggregation efficiencies as a function of shear Reynolds number and inclusion size ratio (best guess value in bold).
Shear rate as a function of shear Reynolds number according to a 10-μm inclusion in liquid steel.
All Figures
|
Fig. 1 Schematics of a steel gas-stirred ladle. |
| In the text | |
|
Fig. 2 Typical scales encountered during flotation process. |
| In the text | |
|
Fig. 3 Boundary and initial conditions applied for the direct numerical simulation of a collision event. |
| In the text | |
|
Fig. 4 Schematic of collision surface between 2 spherical inclusions in driven shear flow providing aggregation kernel. It can be reduced to a quarter cross-section for symmetrical reason. |
| In the text | |
|
Fig. 5 Simulation setup and cross-section derivation from 115 simulations of 2 identical particles at |
| In the text | |
|
Fig. 6 Isocontours of gas retention and turbulent dissipation rates in metallic liquid bath obtained by 3D macroscale simulations [6]. |
| In the text | |
|
Fig. 7 Log-scale distributions in a 60t gas-stirred ladle: liquid volume in shear spectrum (left), and corresponding distributions weighted by collision kernel for different particle size ratios (right). |
| In the text | |
|
Fig. 8 Comparison of two test cases with (in red) and without hydrodynamic collision efficiency (in blue). Initial and after 10 min of stirring PSD (left-hand size), total collision frequency versus time (right-hand size). |
| In the text | |
Current usage metrics show cumulative count of Article Views (full-text article views including HTML views, PDF and ePub downloads, according to the available data) and Abstracts Views on Vision4Press platform.
Data correspond to usage on the plateform after 2015. The current usage metrics is available 48-96 hours after online publication and is updated daily on week days.
Initial download of the metrics may take a while.