| Issue |
Metall. Res. Technol.
Volume 122, Number 6, 2025
Special Issue on ‘Advances in Powder Technologies: Highlights from EuroPM2025’, edited by Efrain Carreño-Morelli, Elena Gordo and Lars Nyborg
|
|
|---|---|---|
| Article Number | 605 | |
| Number of page(s) | 9 | |
| DOI | https://doi.org/10.1051/metal/2025081 | |
| Published online | 16 September 2025 | |
Original Article
New FKM guideline on the analytical strength assessment of components made of sintered steels
1
Fraunhofer LBF, Institute for Structural Durability and System Reliability, 64289, Germany
2
RWTH Aachen University, Chair and Institute for Materials Applications in Mechanical Engineering, 52062, Germany
* e-mail: This email address is being protected from spambots. You need JavaScript enabled to view it.
Received:
30
April
2025
Accepted:
21
July
2025
Abstract
A static and fatigue strength assessment must be carried out for all highly loaded components made of sintered materials. While numerous rules and guidelines exist for components made of wrought or cast steels, as well as for welded structures, no recommendation for the strength assessment of PM-components was previously available. However, at the start of 2025, a new FKM-guideline was published, providing a detailed assessment approach that requires only density and hardness as input parameters. The relevant parameters, such as mean stress sensitivity or highly stressed volume, can likewise be derived from hardness and density. In addition, only a linear-elastic finite-element analysis is necessary, which determines the local stress and its distribution. This paper presents a comprehensive background on the derivation and offers an overview of the assessment approach.
Key words: static and fatigue strength assessment / sintered steels / design guideline
These authors contributed equally to this work.
© J. Baumgartner et al., Published by EDP Sciences, 2025
 This is an Open Access article distributed under the terms of the Creative Commons Attribution License (https://creativecommons.org/licenses/by/4.0/), which permits unrestricted use, distribution, and reproduction in any medium, provided the original work is properly cited.
1 Introduction
Sintered steels have gained widespread use in various industrial applications due to their unique combination of properties. The properties, such as wear resistance, high strength, or controlled porosity can be tailored by the choice of the powder, the compacting pressure, the sintering conditions and, if required, a heat treatment or mechanical hardening process after sintering. Additionally, this manufacturing technique allows for cost-effective production and material efficiency, making sintered steels an attractive choice for many engineering applications. Moreover, components with complex geometries can also be produced.
In particular, the automotive industry relies heavily on sintered steels for components such as gears, bearings, and engine parts. These components are critical to ensuring reliable vehicle performance under a wide range of operating conditions.
One of the key requirements for these sintered steel components is their ability to endure mechanical stress during use. Components must withstand not only the static loads but also the fatigue loads resulting from repeated cycles of use. Ensuring the durability and reliability of sintered steel parts under these demanding conditions is essential for the longevity and safety of automotive applications.
Even though sintered steels are widely used in numerous applications, there is currently no comprehensive design guideline available. This contrasts sharply with steel structures and welded components, where a substantial number of national and international codes and standards offer guidance for engineers across various industries, such as buildings and infrastructure [1,2], cranes [3], machinery [4], offshore structures [5], pressure vessels [6] or general welded structures [7]. The lack of design guidelines for sintered steel is not due to a lack of scientific research in this area. Many individual publications address specific properties, such as the influence of density [8], mean stress [9], and sintering temperature [10] on mechanical characteristics. However, because sintered steels are not used in legally regulated sectors such as bridge construction, crane operations, or maritime applications, the responsibility for ensuring and guaranteeing reliability most likely falls on the companies themselves. As a result, no organization or association has yet undertaken the effort to compile and analyze the relevant data or establish a publicly accessible standard.
The lack of guidelines for sintered steel components makes the design process more complex, particularly for companies with little or no experience in designing PM components. As a result, design cycles become longer, and testing costs increase if proof tests fail. Thus, there is a significant need for a coherent design guideline for sintered steel components to boost efficiency and lower costs in their application.
Within the publicly funded research project [11] described in this paper, the goal was to develop a design guideline for the assessment of static and cyclic loads on sintered components. The assessment approach should align with the numerical framework of the FKM Guideline [4,12], which can be used for the strength assessment of components made of wrought and cast steel based on elastic stresses. Because sintered components typically have a complex geometry, assessing them with nominal stress is not feasible, so the focus is on local stress assessment. These local stresses can be readily derived using a linear-elastic finite-element analysis. The intention was to base the algorithm on a minimal set of material properties − specifically, hardness and density.
FKM stands for Forschungskuratorium Maschinenbau (Research Council for Mechanical Engineering). It operates under the umbrella of the VDMA (Verband Deutscher Maschinen- und Anlagenbau, i.e. the German Engineering Federation).
In this paper, first, the material properties of sintered steel and their correlation to static and fatigue strength are presented. Next, an overview of the data utilized to develop a generalized assessment method is provided. Finally, the assessment algorithm is introduced and discussed in detail.
2 Static strength assessment
As previously stated, the strength assessment should closely follow the approach presented in the FKM Guideline. The basic idea behind the FKM Guideline is that locally endurable static stresses can be determined by multiplying the yield strength Rp by a plastic support factor npl, also referred to as the “section factor for static strength”.
 (1)
(1)
The section factor accounts for two effects: (1) plastic collapse, in which the yield strength is exceeded in a cross section of a component by the plastic notch factor Kp that describes the ratio of elastic to plastic limit load, and (2) the local exceedance of the static strength.
 (2)
(2)
The tolerable strain ϵtol depends on the material type and its properties, while the hardening factor fR is a function of the ultimate and yield strength. The approach was developed in a large research project [13] and leads for the materials considered in the FKM Guideline to a high assessment accuracy.
The application range does not contain sintered steel. However, if the assessment algorithm would be applied for sintered steel, which shows commonly a macroscopically brittle behavior with an elongation at break of A ≤ 6%, according to the FKM Guideline [4] ϵtol is set to Rp/E, resulting in npl = 1. This indicates that the local endurable stress equals the yield strength, meaning no additional support effects can be taken into account numerically. However, this assumption is overly conservative and is known to be invalid for sintered steel [14,15]. Both experimental and numerical investigations show that, despite their macroscopically low ductility, the local endurable static stresses exceed the yield strength of the material.
3 Fatigue properties of sintered steels
Several parameters affect the fatigue properties [16]. The most important ones are density and hardness (as material properties), the highly stressed volume that is determined by the component design, and the loading conditions − specifically the magnitude of stress amplitudes and the mean stress together with the mean stress sensitivity of the material. These key properties and their correlation with the fatigue strength are discussed below.
3.1 Density
Since the early work of Bal’shin [17] it has been known that the density of sintered materials significantly affects various material properties, such as the elastic modulus E and ultimate strength Rm. The correlation between density and material properties can be described by a power law.
 (3)
(3)
This correlation can also be observed between fatigue strength and density when geometrically identical specimens are tested under identical loading conditions, Figure 1.
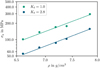 |
Fig. 1 Influence of density on endurable stresses determined at specimens made from Fe − 1,5% Cu − 0.6% C under axial load [8] (N = 2 × 10⁶, R = −1, PS = 50%). |
3.2 Hardness
Aside from sintered steels, the ultimate strength Rm is known to have a strong influence on the fatigue strength of components made from wrought or cast materials. According to the FKM-guideline [4], a linear relationship can be assumed between Rm and the fatigue strength for fully reversed loading  .
.
 (4)
(4)
The factor fW depends on the material type and ranges between 0.30 ≤ fW ≤ 0.45. The significant advantage of this approach is the direct link between a typically known material value and the fatigue strength. Even if the ultimate strength is not known, it can be estimated using approximation formulae, such as those given in ISO 18265.
For sintered steels, however, the ultimate strength of the material is typically not provided. Moreover, there is only a weak correlation between the ultimate strength and the fatigue strength [18]. This issue can be circumvented by selecting another material value: hardness. This value is relatively easy to measure and there is a continuous correlation with the fatigue strength. Previous research [18,19] has shown a strong correlation between hardness and fatigue strength. It should be mentioned that the new FKM guideline considers the fully reversed bending fatigue strength rather than the fully reversed axial fatigue strength, as a considerably larger and more reliable database is available for bending fatigue. For the new FKM-guideline, macro-hardness was measured consistently with HV10 across the entire hardness range, because the larger indentation spans several characteristic PM pores and thus registers the combined matrix-porosity response; employing HV5 below 200 HV, as recommended in ISO 4498, would mainly sample the dense matrix and risk overestimating the effective hardness.
3.3 Highly stressed volume
Stress gradients have a significant effect on local endurable stresses. According to Kloos [20], several “size effects” can be differentiated. The first is the statistical size effect, which originated in Weibull’s investigations on plain (unnotched) specimens subjected to axial loading with varying volumes [21]. He observed that with increasing volume the strength of the specimens decreases. He observed that as the volume increases, the specimen’s strength decreases. Weibull proposed the well-known weakest-link concept, suggesting that a larger material volume increases the probability of encountering a critical defect, thereby making failure more likely. Analytically, this effect can be represented by a stress integral
 (5)
(5)
that evaluates the stress distribution throughout the entire component. While it is easily solved for specimens under uniform stress, performing the evaluation for complex components becomes numerically very demanding, even when finite-element models are used.
To simplify evaluating the influence of the highly stressed volume, Kuguel [22] proposed to take the volume V90% in which the stress decreases from 100% to 90%. Sonsino applied this approach to the fatigue assessment of sintered steels [8] and proposed a power function as a correlation between endurable local stress and highly stressed volume.
 (6)
(6)
With this function, it becomes possible to describe the endurable stresses of specimens or components that differ in their highly stressed volumes, Figure 2.
Another type of size effect is related to stress gradients, such as those found at notches. Multiple approaches can be used to account for this influence:
The stress gradient approach [24], which considers the stress gradient on the surface and is implemented in the FKM Guideline [4].
The critical distance approach [25], which takes the stress in a specific distance from the surface.
The stress averaging approach [26].
Although these methods are widely applied in areas such as welded joint assessment [27], they are seldom used for the assessment of sintered components. Two primary reasons explain this: First, the predominant effect is attributable to statistical size effects rather than stress gradients, due to the high concentration of voids in the material. Second, the highly stressed volume approach inherently accounts not only for statistical size effects but also for stress gradients [23].
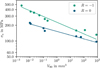 |
Fig. 2 Correlation between endurable local stresses and highly stressed volume for the sintered steel Fe − 4%Ni − 1.5%Cu − 0.5%Mo at N = 107 cycles [23]. |
3.4 Mean stress
The effect of mean stress on the fatigue strength is typically illustrated in a Haigh diagram, where the endurable stresses are plotted as a function of the mean stresses, Figure 3. As the mean stress increases, the endurable stress amplitudes decrease. This relationship can be described by the mean stress sensitivity M, which is defined over specific ranges of R-ratios representing the ratio between lower and upper stress levels. For wrought and cast materials, the mean stress sensitivity can be expressed in terms of the ultimate strength [4,28].
 (7)
(7)
For sintered steels, a multi-linear relationship between stress amplitude and mean stress can also be assumed in the Haigh diagram [9]. However, there is currently no established method to link mean stress sensitivity with material properties such as ultimate strength or density.
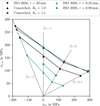 |
Fig. 3 Example of a Haigh diagram of specimen with different geometry for the assessment of mean stresses for a Distaloy AE + 0.6%C, a density of ρ = 7g/cm3 and N = 107 cycles [9]. |
3.5 Other influences
Next to the influence of density, hardness, highly stressed volume and mean stress, there exist various other factors that can impact the fatigue strength. Examples include the temperature, hardening procedure that introduces compressive residual stresses, mechanical hardening that increases the local density or high temperature sintering that leads to a better void morphology, just to name a few.
4 Test database and evaluation
4.1 Data base
To achieve a generalized assessment approach applicable to a wide variety of sintered steels, a substantial amount of static and fatigue data was collected. The following parameters were required: specimen geometry, as well as chemical composition, hardness, density, surface condition, and, when available, sintering conditions, such as temperature, time, and atmosphere.
In the case of static data, the static strength of unnotched and notched specimens had to be available. All static test data was provided by GKN, Germany, which has partly been published in [14].
In the case of fatigue data, cycles N, endurable stresses σ, and mean stress σm or R-ratio had to be available. In certain instances, only endurable stresses were available, with no S-N data provided. These results have also been incorporated in the later assessment. In total, 22.000 S-N data points have been gathered that were used for further evaluation.
The following types of material have been considered. The abbreviation “pa” denotes that the powder has been pre-alloyed:
Fe
Fe-C
Fe-Cu
Fe-Cu-C
Fe-1.75% Ni-1.5% Cu-0.5% Mo (-C)
Fe-4% Ni-1.5% Cu-0.5% Mo (-C)
0.85% Mo (pa)-LE-C; LE: Cu, Ni
1.5% Mo (pa)-2% Cu (-C)
1.5% Mo (pa)-4% Ni-2% Cu (-C)
(1.5–1.8)% Cr (pa) (-0.2% Mo (pa))-C
3% Cr (pa)-0.5% Mo (pa)-C.
Next to the fatigue data, the specimen’s geometry has a significant impact on local endurable stresses, since it determines (next to the loading type, such as axial load, bending or torsion) the local maximum stress amplitudes σ and the highly stressed volume V90. Subsequently, finite-element models of 35 different specimen types have been created and stress concentration factors Kt = σmax/σn as well as highly stressed volumes V90 were evaluated. In many cases, the thickness of the specimens varied. As a result, multiple models were created and evaluated. Further information on the data basis can be taken from [11,29].
4.2 Evaluation of static strength
The assessment algorithm of the static strength should be aligned with the one in the FKM guideline. In order to achieve this, the parameters in equations (1) and (2) need to be identified. Whereas the elastic modulus E and Poisson’s ratio ν can easily be derived by the Bal’shin relationship using the density, see equation (3), there is no known relationship between the yield and ultimate strength Rp resp. Rm and the hardness HV. This correlation was established using static strength data of unnotched specimens according ISO 2740 [30]. In a same way, an empirical correlation was established by the elongation at break A and the hardness. Having the properties Rp, Rm and A an evaluation of the section factor npl can be performed according to the algorithm of the FKM-guideline.
The application of this algorithm leads to quite conservative results, especially for sintered steels with a high strength, as a comparison between experimentally determined statically endurable local stresses and numerically evaluated show, Figure 4. Therefore, a correction term was implemented that increases the static strength for high-strength materials. With this correction term that is described in Section 5, the factor between the mean line which represents a survival probability of PS = 50% and the evaluated static strength is constant.
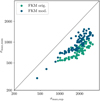 |
Fig. 4 Comparison between numerically and experimentally determined local statical endurable stresses. |
4.3 Evaluation of fatigue strength
Overall, three different evaluation procedures were employed for the fatigue assessment: The first evaluation utilized five distinct machine learning approaches, resulting in a low residual scatter and high assessment reliability. However, since the approaches that incorporated explainable AI were unsuccessful, and black box AI is not suitable for use in rules and guidelines, those results were not utilized. The findings have already been published [29], and no further details are provided here.
The second evaluation focused on parameter optimization, using all specimens for which S-N data was available. Known relationships and influences were predefined, such as the power function relationship between local endurable stress and highly stressed volume, where the exponent n in equation (6) needs to be evaluated. Additionally, if literature suggested a correlation between a variable and a material property, that relationship was also considered. For instance, mean stress sensitivity is dependent on material hardness. As an optimization aim the scatter of a reference S-N curve was minimized. For this, all S-N data was transformed to reference values (hardness HV10 = 200, Volume V90 = 1mm3, Mean stress σm = 0 and density ρ = 7g/cm3). Further information on this approach are available in [31].
The third evaluation is directly based on the Bal’shin equation, as described in equation (3), which expresses the mechanical properties of porous steels as a function of both hardness and density. This allows for a description of both the influence of density on fatigue strength and the influence of density on hardness. By dividing these two relationships, equation (8) is obtained.
 (8)
(8)
A mean density exponent m1 = 5.0 was derived from more than 40 documented density dependencies of bending and fatigue strength in sintered steels. Similarly, an exponent m2 = 4.35 was determined from over 100 density-related datasets of Vickers hardness. When equation (8) is applied for a typical density value of 7.0 g/cm3, representative of common sintered steel grades, it yields an estimate of the fatigue strength, equation (9).
 (9)
(9)
Furthermore, the highly stressed volume V90 equation. (6) was used to account for the influence of geometric discontinuities and the statistical size effect on fatigue strength, enabling a transferability to notched components. Regression analyses were conducted to determine the parameters for equation (6). The reference volume was set to 1 mm3. To ensure material-independent applicability, the equation was formulated as a function of the fatigue strength of an unnotched specimen with V90 = 10mm3 , resulting in the following expression:
 (10)
(10)
The second and third evaluation procedure did lead to quite similar results in terms of assessment reliability. The results of the third approach have been used to quantify the relationship between input parameters and fatigue strength, presented in the following. The application of this algorithm to the cyclic fatigue assessment is noticeably less conservative than in the static assessment, as the point cloud of experimentally determined and numerically evaluated cyclically endurable local stresses lies much closer to the bisecting line and even a few data points are slightly overestimated by the new guideline (see Fig. 5). Moreover, the agreement is particularly good for high-strength materials, while somewhat larger deviations remain for lower strength levels.
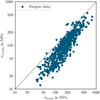 |
Fig. 5 Comparison between numerically and experimentally determined endurable stresses. |
5 Assessment algorithm
In this chapter, a description of the algorithm for static and fatigue assessment is given. It is important to note that this description gives only an overview of the whole assessment algorithm and cannot be used for an assessment of sintered parts. The whole algorithm is given in the new FKM guideline [32] “Analytical strength assessment of components made of sintered steels”.
5.1 Static strength assessment
Static strength should be assessed for the load cases that lead to the highest stresses in the components during operation. A plane stress condition on the surface is assumed. As acting stresses, both, maximum principal stresses σ1, σ2 as well as von Mises stresses σv, are used. The hydrostatic stress σH is used to derive a degree of multiaxiality h that has an impact on the local endurable stresses.
In the next step, the material properties are evaluated. The yield and ultimate strength are estimated by equation (11) and (12). The density-dependent elastic modules is derived by the Bal’shin equation with m = 3.4 as exponent, equation (13). The same if done for the Poisson’s ratio ν.
 (11)
(11)
 (12)
(12)
 (13)
(13)
Having all material parameters evaluated, the section factor npl is calculated by equation (14),
 (14)
(14)
where etol is a function of σv, σ1 and σ2 (to account for the multiaxiality) as well as E and Rp.
With the section factor, the local endurable static stress can be evaluated using equation (1). The final assessment is performed by dividing the acting von Mises stress σv by the endurable stress, equation (15). In addition, a safety factor jD is included in the equation that considers uncertainties, both on material and load side.
 (15)
(15)
If the resulting degree of utilization a is lower or equals one, the assessment is successful. A safe operation of the component can be expected.
5.2 Fatigue strength assessment
The algorithm for the fatigue strength assessment follows the same structure as the one for the static strength. In the first step, the principal stresses are calculated. In addition, in the case of variable amplitude loading, the load spectrum has to be identified. The stress amplitude, mean stress resp. R-ratio and the number of cycles under these conditions have to be derived.
The material properties are, as for the static strength assessment, derived by the density and hardness of the material, equation (16).
 (16)
(16)
where σW,50 is the endurable stress for a survival probability of PS = 50% the factor nW determines to
 (17)
(17)
and a R-ratio of R = − 1 is assumed. The factor 0.85 is an additional safety factor to account for the uncertainties in the assessment approach. Based on the PS = 50%-value, the endurable stresses for a survival probability PS = 97.5% can be derived that considers the typical scatter of a single S-N curve for sintered steel [33].
 (18)
(18)
In the next step, the effect of the design is taken into consideration including by the highly stressed volume V90 that must be determined from a finite-element model. Next, a support factor nHBV is evaluated
 (19)
(19)
and the endurable stresses at the component σWK for a stress ratio of R = −1 can be determined, equation (20). In the same step, also the effect of any post-treatment, such as hardening, is considered. Due to space constraints, a detailed presentation has been omitted.
 (20)
(20)
The influence of the mean stress on the fatigue strength is evaluated by a mean stress sensitivity that depends on the endurable stresses at the component. With this approach, the influence of the hardness on the mean stress sensitivity can be incorporated in the assessment. The mean stress sensitivity in the range ∞ ≤ R ≤ −1 is determined by
 (21)
(21)
Based on the mean stress sensitivity Mσ, the factor KWK can be derived and with it the endurable stresses of the component under consideration of the highly stressed volume and the mean stress, equation (22). The formula to derive KWK depends on the range of stress ratio of each cycle (KWK = f (Mσ, σa, σm, R)). These are not displayed in detail due to space constraints.
 (22)
(22)
In case of variable amplitude loading, an approach is applied that relies on the linear damage calculation according to Palmgren and Miner [34]. First, a damage equivalent amplitude that can be interpreted as a damage-equivalent constant amplitude stress is derived from the stress spectrum.
 (23)
(23)
The parameters used in the equation are the damage sum Dpm = 0.5, the slope of the S-N curve k = 7 and the stress amplitudes σa, and its assigned number of cycles n for stresses higher than the knee point (index i) and lower than the knee point (index j). This equivalent stress is defined for the total number of cycles in the spectrum and must be transformed to N = 106 cycles.
 (24)
(24)
With the variable amplitude fatigue strength factor KBK
 (25)
(25)
The damage equivalent stress amplitude
 (26)
(26)
is calculated. In case of constant amplitude loading KBK is set to one.
The fatigue strength assessment is, as for the static strength assessment, performed by evaluation of a degree of utilization considering and additional safety factor jD, equation (27).
 (27)
(27)
6 Discussion
In this work, for the first time a generalized assessment approach has been complied for the static and fatigue strength assessment of components made from sintered steel. As input data, only two parameters need to be available: the hardness HV10 and the density ρ. Both parameters can typically be estimated by engineers with experience in press and sinter processes or be derived by a numerical process simulation. The applicability range includes 12 commonly used sintered steels most often used for highly stressed components.
The assessment algorithms inherits features from two sources: First, the overall assessment algorithm is aligned to the FKM Guideline [4], a commonly used code for the strength assessment of components. Second, since the FKM Guideline does not consider PM-specific properties, such as porosity or the dominating effect of statistical size effects, relationships between influencing factors have been used that have been derived for sintered steels. In detail, many adjustments had to be made, for example a modification of the section factor npl or the consideration of the highly stressed volume. In addition, new correlations have been derived, such as the impact of hardening process on the fatigue strength.
As is true for all rules and guidelines, the application range is limited to the properties of the specimens that have been used to parametrize the assessment approach. It is limited to components with a maximum hardness of H ≤ 600HV10 and to a density range of 6.4g/cm3≤ 7.4g/cm3. The following aspects cannot be covered: low cycle fatigue, corrosion, creep, impact loads, multiaxial (non-proportional) loading and elevated temperatures T > 100 °C. A detailed scope is listed in the guideline [32]. In addition, due to limited input data for the static strength assessment, the highly stressed volume for the static strength assessment must be higher 0.01 mm3.
It should be mentioned that commonly known and accepted relationships have been used to identify the parameters that lead to an accurate and reliable design approach. However, there is still space for improvement. For example, it is known that the slope of the S-N curve depends on the notch severity; components with sharp notches typically show steeper slopes [35]. Moreover, the mean stress sensitivity depends not only on the hardness but might correlate to the notch severity, see Figure 2. The space for a possible improvement show the application of an ANN [29] for the assessment. An identification and implementation of these correlations would improve slightly the assessment accuracy, but for the costs of an increase in complexity of the assessment approach (in case of a more complex algorithm) or the loss of explainability using ANN.
7 Conclusions
The following main conclusion can be taken from this publication:
The new FKM-guideline “Analytical strength assessment of components made of sintered steels” [32] is the world-wide first publicly available design guideline.
The assessment approach was developed and parametrized based on a huge database with over 22.000 individual fatigue curves and 2 × 64 static strength tests. The fatigue tests have been conducted on 34 different specimens with different thicknesses and materials, representing an extremely wide range of parameters. Subsequently, a high assessment reliability is expected even at components with locally complex stress states.
Companies and engineers are encouraged to apply this new guideline for the strength assessment of components. Any feedback is highly appreciated to improve the applicability and, in future, the application range and reliability.
Nomenclature
Latin symbols
E: Elastic modulus
M: Mean stress sensitivity
R: R-ratio
Rp: Yield strength
Rm: Ultimate strength
V90: Highly stressed volume
Kp: Plastic notch factor
Ps: Survival probability
N: Number of cycles
H: Hardness HV10 according to Vickers
aSK: Degree of utilization for the static assessment
fR: Hardening factor
h: Degree of multiaxiality
k: Slope of the S-N curve
nHBV: Factor for highly stressed volume
npl: Section factor for static strength
nW: Material factor
Greek symbols
ϵref: Reference strain
ϵtol: Tolerable strain
ν: Poisson’s ratio
ρ: Density
σ: Acting local stress
σ1,2,3: Principal stresses
σAK: Endurable stresses under constant amplitudes
σBK: Endurable stresses under variable amplitudes
σeq,D: Acting damage equivalent stress for N = ND
σeq: Acting damage equivalent stress for 
σmax: Acting maximum local stress
σmax: Acting minimum local stress
σNH:
σW,50: Endurable stresses of the material1)
σWK: Endurable stresses at the component3)
σW: Endurable stresses of the material2)
Indices
ref: Reference
a: Amplitude
m: Mean value
max: Maximum value
min: Minimum value
1) Ps = 50.0%, R = –1, V90 = 10mm3.
2) Ps = 97.7%, R = –1, V90 = 10mm3.
3) Ps = 97.7%, R = –1.
Acknowledgments
The authors would like to express their gratitude to all members of the industrial steering committee for their invaluable support of this research project. Special thanks to Dr. Markus Schneider (GKN) for providing the results of the static strength tests and Mr. Ralf Waterkotte (Schaeffler) for his endurance and motivation in the funding acquisition and research and phase. The support of and discussions with Prof. Paul Beiss and Prof. Cetin Morris Sonsino are greatly acknowledged. The financial support of the VDMA is highly appreciated, without a compilation of the research results into a mature guideline would not be possible.
Funding
The presented investigations were part of the IGF project of the research association FKM e.V. under the grant 20.234 N. It was funded by the Federal Ministry of Economics Affairs and Climate Action BMWK via the AiF e.V. within the framework of the program for the promotion of joint industrial research and development (IGF) on the basis of a resolution of the German parliament.
Conflicts of interest
The authors have nothing to disclose.
Data availability statement
Data associated with this article cannot be disclosed due to legal reasons.
Author contribution statement
Investigations and methodology, all; Writing − Original Draft Preparation, J.B.; Writing − Review & Editing, T.H., K.B., F.R.; Funding Acquisition, J.B. and K.B.
References
- European Commitee for Standardization, DIN EN 1993-1-9:2023-3-Design of steel structures − Part 1-1: General rules and rules for buildings (2023) DIN EN 1993-1–9 [Google Scholar]
- European Commitee for Standardization, DIN EN 1999-1-3:2024-11-Design of aluminium structures − Part 1-3: Structures susceptible to fatigue (2024) [Google Scholar]
- European Standard, EN 13001-3-1:2019-3-Cranes D General Design D Part 3-1: Limit States and proof competence of steel structure (2019) [Google Scholar]
- R. Rennert, E. Kullig, M. Vormwald et al., Analytical strength assessment of components: FKM Guideline, 7th Edition, VDMA, Frankfurt am Main (2020) [Google Scholar]
- DNV, RP-C203: Fatigue design of offshore steel structures (2024), DNV-C203:2024-10 [Google Scholar]
- Normenausschuss Chemischer Apparatebau (FNCA) and DIN Deutsches Institut für Normung e.V., EN 13445-3:2018: Unfired pressure vessels, Part 3: Design (2018) [Google Scholar]
- A.F. Hobbacher, J. Baumgartner, Recommendations for Fatigue Design of Welded Joints and Components, Springer Nature Switzerland, Cham (2024) [Google Scholar]
- C.M. Sonsino, Fatigue design of high loaded PM parts, Metal Powder Report 5, 32–40 (1996) [Google Scholar]
- K. Lipp, J. Baumgartner, P. Beiss, Fatigue design of sintered steel components: effect of stress concentrations and mean stresses on local strength using highest stressed volume approach, Powder Metall. 56, 337–341 (2013) [Google Scholar]
- E.A. Sager, R.I. Stephens, T. Prucher, Influence of density and sintering temperature on monotonic, cyclic, and low cycle fatigue behaviour of FL4405 high strength PM steel, Powder Metall. 41, 103–108 (1998) [Google Scholar]
- K. Burkamp, P. Beiss, F.-C. Reissner et al., FKM-Vorhaben Nr. 614: Bauteilfestigkeit von wärmebehandeltem Sinterstahl (2022) [Google Scholar]
- R. Rennert, M. Vormwald, A. Esderts, FKM-guideline “Analytical strength Assessment” − Background and current developments, Int. J. Fatigue 182, 108165 (2024) [Google Scholar]
- W. Hanel, M. Vormwald, A. Esderts et al., AiF 15361: Ein verbessertes Berechnungskonzept des statischen Festigkeitsnachweises und des Ermüdungsnachweises für nichtgeschweißte und geschweißte Maschinenbauteile nach der FKM Richtlinie “Festigkeitsnachweis” (engl.: An improved calculation concept for the static strength verification and fatigue verification of non-welded and welded machine components according to the FKM Guideline “Strength Assessment.”) (2009) [Google Scholar]
- M. Schneider, Notch strength and sensitivity of sintered steels, in Euro PM2013 congress and exhibition (2013) [Google Scholar]
- M. Schneider, Density dependent approximation of stress-strain curves for elastic-plastic FEA-calculations, in Euro PM2019 congress and exhibition (2019) [Google Scholar]
- C.M. Sonsino, Fatigue design concepts for P/M parts and required material data: An overview, Metal Powder Industries Federation, Princeton, NJ (2003) [Google Scholar]
- M.Y. Bal’shin, Relation of mechanical properties of powder metals and their porosity and the ultimate properties of porous metal-ceramic materials, Doklady Akademii Nauk SSSR 67, 831–834 (1949) [Google Scholar]
- B.L.P. Engdahl, J. Tengzelius, Fatigue Behaviour of PM Steels − Material Aspects: PM into 1990’s, The Institute of Metals, London (1990) [Google Scholar]
- J. Campbell-Tremblay, C. Blais, G. L’Espérance et al., Characterization of the fatigue performance of P/M components produced with powders developed for improved machinability, in 2005 International Conference on Powder Metallurgy and Particulate Materials, PowderMet 2005 (2005), pp. 150–159 [Google Scholar]
- K.H. Kloos, A. Buch, D. Zankov, Pure geometrical size effect in fatigue tests with constant stress amplitude and in programme tests, Materialwissenschaft und Werkstofftechnik 12, 40–50 (1981) [Google Scholar]
- W. Weibull, A statistical theory of the strength of materials, Proceedings of the Royal Swedish Institute for Engineering Research, Generalstabens Litografiska Anstalts Förlag (1939) [Google Scholar]
- R. Kuguel, A relation between theoretical stress concentration factor and fatigue notch factor deduced from the concept of highly stressed volume, in Sixty-fourth Annual Meeting of the Society (ASTM), June 25-30, pp. 732–744, ASTM (1961) [Google Scholar]
- J. Baumgartner, K. Lipp, T. Bruder et al., Design methods for reliable fatigue assessment of PM components, Materialwissenschaft und Werkstofftechnik 42, 894–903 (2011) [Google Scholar]
- E. Siebel, M. Stieler, Ungleichförmige Spannungsverteilung bei schwingender Beanspruchung, VDI Zeitschrift 97, 121–126 (1955) [Google Scholar]
- D. Taylor, Geometrical effects in fatigue: a unifying theoretical model, Int. J. Fatigue 21, 413–420 (1999) [Google Scholar]
- H. Neuber, Über die Berücksichtigung der Spannungskonzentration bei Festigkeitsberechnungen, Konstruktion 20, 245–251 (1968) [Google Scholar]
- J. Baumgartner, H. Schmidt, E. Ince et al., Fatigue assessment of welded joints using stress averaging and critical distance approaches, Weld World 59, 731–742 (2015) [Google Scholar]
- W. Schütz, Über eine Beziehung zwischen der Lebensdauer bei konstanter und bei veränderlicher Beanspruchungsamplitude und ihre Anwendbarkeit auf die Bemessung von Flugzeugbauteilen, Zeitschrift für Flugwissenschaft 15, 407–419 (1967) [Google Scholar]
- D.S. Leininger, F.-C. Reissner, J. Baumgartner, New approaches for a reliable fatigue life prediction of powder metallurgy components using machine learning, Fatigue Fract. Eng. Mat. Struct. 46, 1190–1210 (2023) [Google Scholar]
- DIN Deutsches Institut für Normung e. V. (German Institute for Standardization), ISO 2740:2023 Sintered metal materials, excluding hardmetals −Tensile test pieces (2023) [Google Scholar]
- F.-C. Reissner, J. Baumgartner, E. Haberlick et al., Data-driven calculation of S-N curves for powder metallurgy components, in World PM 2022 Congress Proceedings, European Powder Metallurgy Association (EPMA) (2022) [Google Scholar]
- K. Burkamp, T. Hajeck, J. Baumgartner et al., FKM-Guideline − Analytical strength assessment of components made of sintered steels, Forschungskuratorium Maschinenbau (FKM) (2024) [Google Scholar]
- K. Burkamp, C. Broeckmann, P. Beiss, Statistical evaluation and scatter of fatigue strength data of sintered steels, in Euro PM2019-Modelling & Sintering of PM Steels (2019) [Google Scholar]
- C.M. Sonsino, J. Baumgartner, M. Breitenberger, Equivalent stress concepts for transforming of variable amplitude into constant amplitude loading and consequences for design and durability approval, Int. J. Fatigue 162, 106949 (2022) [Google Scholar]
- W. Eichlseder, Fatigue analysis by local stress concept based on finite element results, Comput. Struct. 80, 2109–2113 (2002) [Google Scholar]
Cite this article as: Jörg Baumgartner, Karl Burkamp, Tobias Hajeck, Felix Reissner, New FKM guideline on the analytical strength assessment of components made of sintered steels, Metall. Res. Technol. 122, 605 (2025), https://doi.org/10.1051/metal/2025081
All Figures
|
Fig. 1 Influence of density on endurable stresses determined at specimens made from Fe − 1,5% Cu − 0.6% C under axial load [8] (N = 2 × 10⁶, R = −1, PS = 50%). |
| In the text | |
|
Fig. 2 Correlation between endurable local stresses and highly stressed volume for the sintered steel Fe − 4%Ni − 1.5%Cu − 0.5%Mo at N = 107 cycles [23]. |
| In the text | |
|
Fig. 3 Example of a Haigh diagram of specimen with different geometry for the assessment of mean stresses for a Distaloy AE + 0.6%C, a density of ρ = 7g/cm3 and N = 107 cycles [9]. |
| In the text | |
|
Fig. 4 Comparison between numerically and experimentally determined local statical endurable stresses. |
| In the text | |
|
Fig. 5 Comparison between numerically and experimentally determined endurable stresses. |
| In the text | |
Current usage metrics show cumulative count of Article Views (full-text article views including HTML views, PDF and ePub downloads, according to the available data) and Abstracts Views on Vision4Press platform.
Data correspond to usage on the plateform after 2015. The current usage metrics is available 48-96 hours after online publication and is updated daily on week days.
Initial download of the metrics may take a while.