Open Access
Fig. 1
Download original image
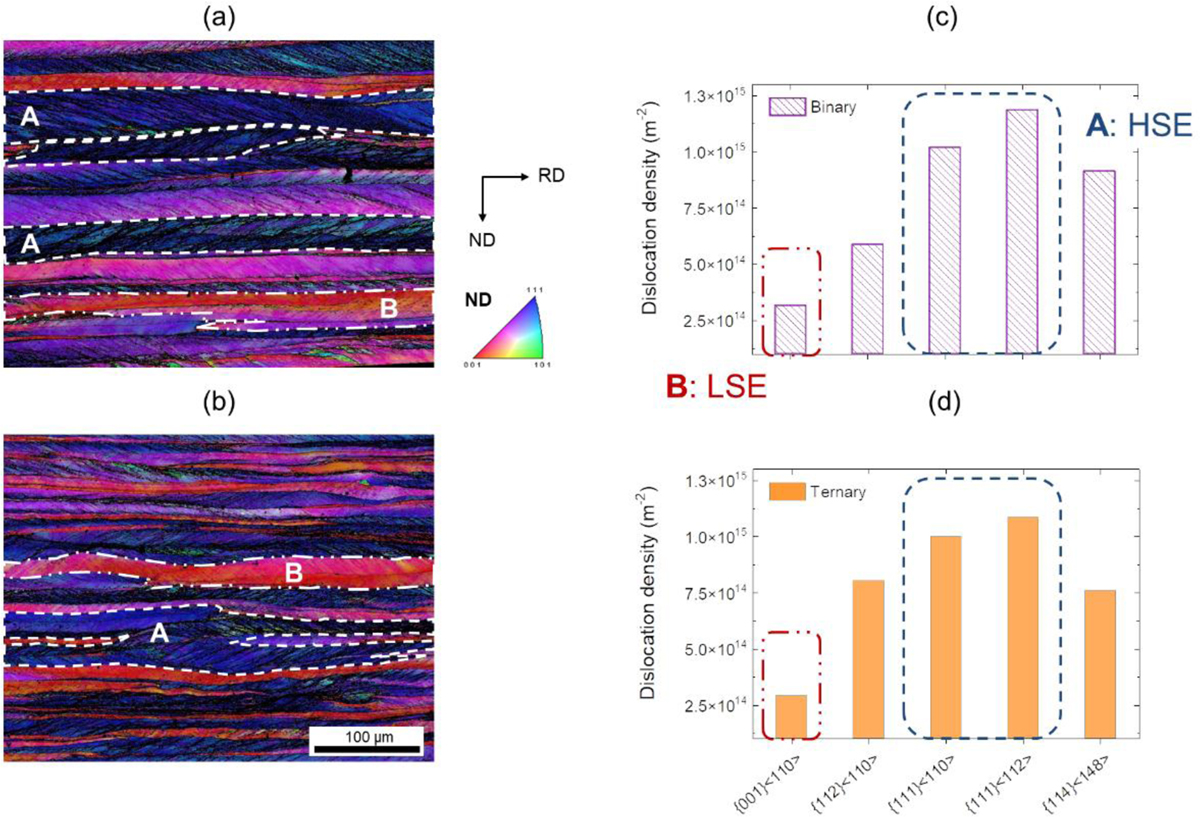
As-deformed microstructure from EBSD showing HSE ‘A’ and LSE ‘B’ regions in the (a) binary and (b) ternary alloys. The corresponding dislocation density calculated as a function of grain orientation from the EBSD data is shown (c) for the binary and (d) for the ternary alloys.
Current usage metrics show cumulative count of Article Views (full-text article views including HTML views, PDF and ePub downloads, according to the available data) and Abstracts Views on Vision4Press platform.
Data correspond to usage on the plateform after 2015. The current usage metrics is available 48-96 hours after online publication and is updated daily on week days.
Initial download of the metrics may take a while.