Open Access
Fig. 1
Download original image
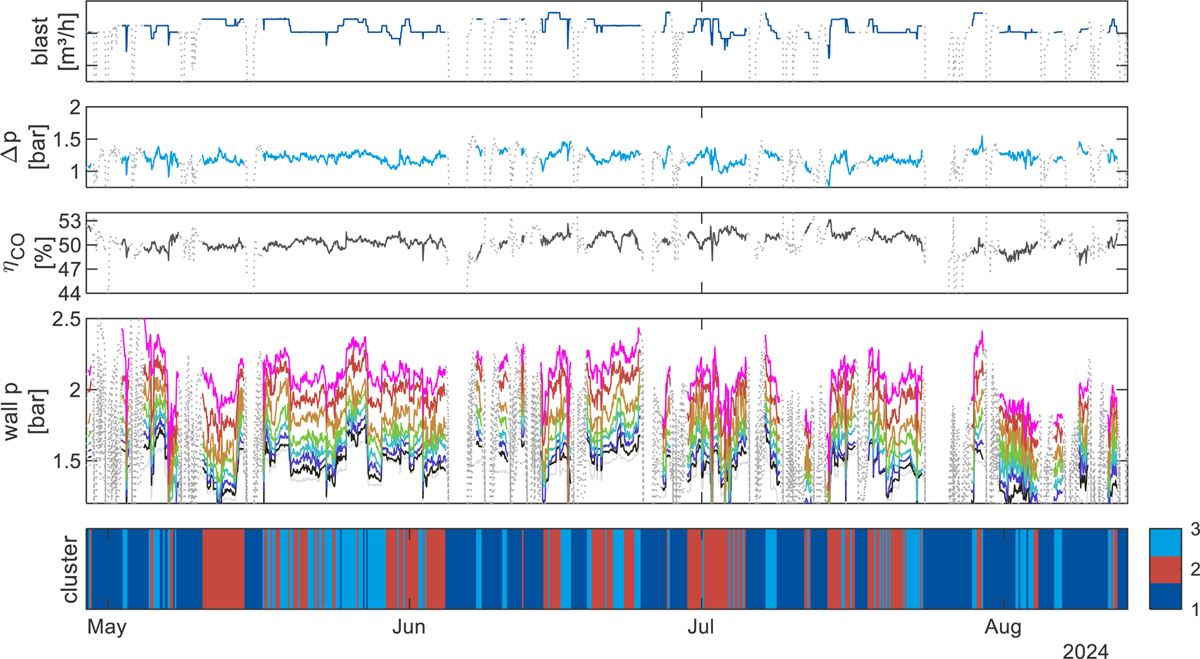
Visualization of an extract of the data used for the study and assigned clusters (visualization shows hourly average values for better overview − minute data used for the study, dotted lines indicate removal of the data around blast furnace stoppages, hot blast data anonymised).
Current usage metrics show cumulative count of Article Views (full-text article views including HTML views, PDF and ePub downloads, according to the available data) and Abstracts Views on Vision4Press platform.
Data correspond to usage on the plateform after 2015. The current usage metrics is available 48-96 hours after online publication and is updated daily on week days.
Initial download of the metrics may take a while.