Open Access
Fig. 10
Download original image
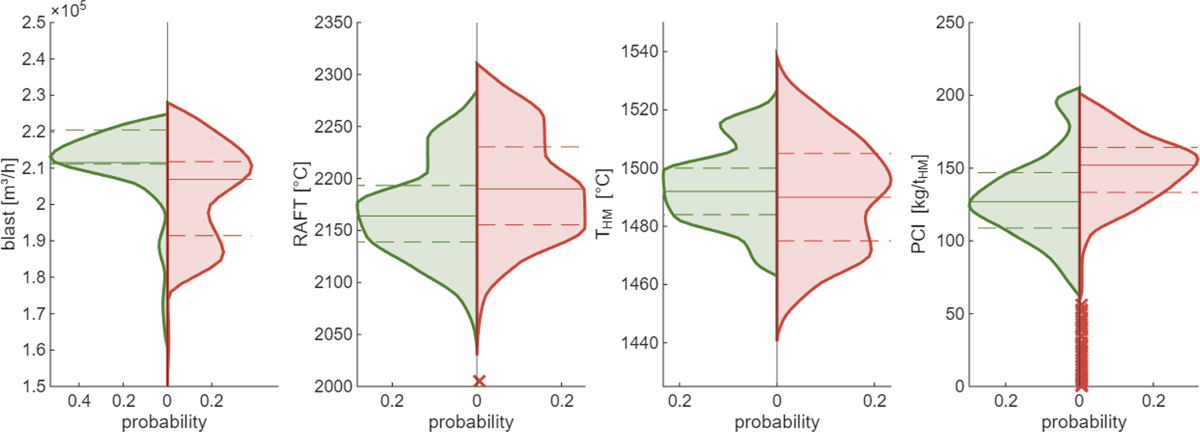
Value distribution of (left to right) blast volume, Raceway adiabatic flame temperature, hot metal temperature and pulverised coal injection during no indication of flow disturbances (green distribution plot left) and indication of flow disturbance (right, red distribution plot).
Current usage metrics show cumulative count of Article Views (full-text article views including HTML views, PDF and ePub downloads, according to the available data) and Abstracts Views on Vision4Press platform.
Data correspond to usage on the plateform after 2015. The current usage metrics is available 48-96 hours after online publication and is updated daily on week days.
Initial download of the metrics may take a while.