| Issue |
Metall. Res. Technol.
Volume 119, Number 5, 2022
|
|
|---|---|---|
| Article Number | 517 | |
| Number of page(s) | 12 | |
| DOI | https://doi.org/10.1051/metal/2022071 | |
| Published online | 12 September 2022 | |
Regular Article
Phase transformation model for adjusting the cooling conditions in Stelmor process to obtain the targeted structure of thermomechanically rolled wire rod used for fastener production
1
CMC Poland, ul. Piłsudzkiego 82, 42-400 Zawiercie, Poland
2
AGH University of Science and Technology, Faculty of Metals Engineering and Industrial Computer Science, al. Mickiewicza 30, 30-059 Kraków, Poland
3
Lukasiewicz Research Network, Institute for Ferrous Metallurgy, ul. K. Miarki 12, 44-100 Gliwice, Poland
* e-mail: This email address is being protected from spambots. You need JavaScript enabled to view it.
Received:
21
March
2022
Accepted:
8
July
2022
Abstract
The paper demonstrates the capability of the developed phase transformation model to design the cooling conditions in the Stelmor process allowing for obtaining different types of microstructures in wire rod of 32CrB4 steel. The model based on modified JMAK equation was developed using the results of the tests conducted in a DIL 805 A/D/T dilatometer. The model is composed of sub-models of ferritic, pearlitic, bainitic and martensitic transformations. Its predictive capability was confirmed in industrial conditions by performing trials with different settings of fans involved in the cooling process on the Stelmor line of CMC Poland. Excellent performance of the model was achieved through the modification of commonly used equations which allows accurate predictions of the phase transformations start and finish temperatures, as well as volume fraction of microstructural constituents, in a wide range of cooling rates. It was demonstrated that the model can effectively be applied to design the cooling conditions in the Stelmor process, which will result in the required microstructural composition of the wire rod.
Key words: wire rod for cold heading applications / Stelmor process / phase transformations / dilatometric tests / JMAK model
© M. Piwowarczyk et al., Published by EDP Sciences, 2022
 This is an Open Access article distributed under the terms of the Creative Commons Attribution License (https://creativecommons.org/licenses/by/4.0/), which permits unrestricted use, distribution, and reproduction in any medium, provided the original work is properly cited.
1 Introduction
In wire rod mills, billets are rolled to wire rods of different diameters with a wide spectrum of applications. Wire rods of various steel grades, usually containing alloying elements, are produced in these mills to fit the specialized applications. Required microstructure and mechanical properties are obtained by controlled cooling during rolling and Stelmor process. Cooling conditions in the Stelmor line applied for developing favourable microstructure of wire rod used for fasteners production are well known and widely used in industrial practice [1]. After the coil formation at the laying head, cooling is performed under covers to ensure low cooling rate throughout the phase transformations temperature range, leading to the formation of ferrite-pearlite microstructure in wire rod. New perspectives have been identified recently by developing in the wire rod different types of bainitic microstructures or a mixture of ferrite and bainite. To obtain these microstructures, perfect control of the cooling conditions must be applied including combination of fast and slow cooling stages. This can be achieved due to the wide flexibility of the Stelmor process, in which the wire rod can be forced cooled by sets of fans. Over the years, a trial-and-error method has been used at CMC Poland to determine cooling conditions in the Stelmor process to obtain the required volume fraction of microstructural constituents and thus the desired mechanical properties of the wire rod. However, this method is expensive and time consuming. Therefore, an alternative method is presented in this paper, which relies on applying the phase transformation model to identify the effect of Stelmor line cooling conditions on phase transformation occurring in the wire rod. This approach was used by many researchers and turned out to be very effective in the numerical modelling of pearlite transformation arising in the wire rod of eutectoid steels [2]. The examples of numerical simulations of cooling in the Stelmor line of the wire rod of ferrite-pearlite steels can also be found in the literature [3]. It is worth mentioning that recently, much emphasis concerning the Stelmor process numerical simulations has been focussed on the precise description of the boundary conditions.
In the process of phase transformations modelling in the Stelmor process, generally a simple form of the JMAK equation has been used [2,4]. Due to this, the accuracy of phase transformations predictions is limited and depends on the cooling rate. Therefore, one of the aims of the paper is to present the improved JMAK model’s capability to predict phase transformations occurrence during the Stelmor process applied to the 32CrB4 steel. Also, an effective approach to the identification of the phase transformation model by using the results of dilatometric tests performed under continuous cooling conditions is presented.
2 Wire rod production process at CMC Poland
The wire rod production process at CMC Poland consists of two main technological stages. The first is the thermomechanical rolling of billets to the final shape, followed by the second stage of controlled cooling in the Stelmor line. Prior to rolling, the billets (160 mm × 160 mm in cross section) are heated in a walking beam furnace to temperature in the range of 1080–1150 °C and are held for 30–60 min. After rolling in the roughing group, accelerated cooling in three water boxes is performed, leading to a reduction of band temperature to 875 ± 20 °C. This temperature is the temperature of entering the intermediate rolling mill stands when the final diameter of the wire rod is less than 14 mm. If the final wire rod diameter is greater than 14 mm, the intermediate rolling mill stand is not used. After the finishing mill (RSM), the band can be cooled in an accelerated manner using three water boxes. When the controlled cooling is used, the entry temperature on the laying head is held in the range of 875–750 °C. After coils are formed at the laying head, the band is subjected to controlled cooling in the 120 m long Stelmor line. The wire rod cooling at the Stelmor conveyor is one of the most complex metallurgical processes [2,5]. The Stelmor line, which is the focus of this investigation, is composed of twelve consecutive cooling zones located along the conveyor, equipped with air blowing fans. Alternatively, retarded cooling can also be applied to the wire rod in the Stelmor line by using the covers over the Stelmor conveyer. Thus, the Stelmor process allows to control the cooling rate, and as a result, the phase transformations occurrence in the wire rod by adjusting the operational capacity of each fan and the distribution of air velocity within the coil. Accordingly, the well-designed Stelmor process tailors the microstructure and mechanical properties of the wire rod.
The capabilities of the Stelmor process were intensively investigated in the last decades of the 20th century, see for example [6–8]. Even though this air-cooling process looks simple, due to the complex geometrical structure of wire loops, the cooling rate is different in each region within the loop. Therefore, during the last four decades, there has been much research activity focused on the application of numerical modelling to support the design of the Stelmor cooling technology. The models are composed of the thermal and metallurgical. The former describes the changes of the temperature in the loops of wires. A comprehensive review of the thermal models of the Stelmor system can be found in [5]. The latter predict the kinetics of phase transformations during cooling and the mechanical properties of the final rods − and this part was the objective of this work.
3 Aim of the investigation
The investigation presented in this paper was a part of the research project “Execution of R&D works to create the innovative thermo-mechanical technology for rolling CHQ steels, necessary for development of innovative wire rod providing unique combination of technological, mechanical and structural parameters ensuring its highest susceptibility to cold heading processing” (Project No. POIR.01.02.00-00-0159). Generally, thermomechanical controlled rolling leads to the formation of non-recrystallized austenite after the last deformation, which is a prerequisite for obtaining a fine ferrite-pearlite microstructure, characterised by a favourable combination of strength and ductility. This is caused by rolling in a finish mill below the so-called recrystallization stop temperature. The effective application of the thermomechanical rolling technology also requires the application of niobium microalloying, as Nb is the most effective element retarding static recrystallization [9]. It is worth mentioning that this type of rolling is associated with the accelerated-controlled cooling after rolling, which is another mechanism of microstructure refinement. The entire concept of thermomechanical rolling cannot be directly applied to the wire rod rolling process, since severe deformation, high strain rates and temperature increase due to the plastic working favours the occurrence of different types of recrystallization. Therefore, a new concept of thermomechanical processing, which is dynamic recrystallization-controlled rolling, was developed in the case of the wire rod rolling process [10]. In this concept, the rolling parameters are adjusted in such a way that during final passes, the growth of recrystallized grains is inhibited. As a result, a unique austenite microstructure is developed, composed of very fine austenite grains smaller than 20 μm. In the research project completed at CMC Poland, the retardation of austenite grain growth was achieved by reducing the ingot reheating temperature to 1080 °C and by applying a low rolling rate in the roughing mill, combined with intense cooling in water boxes. As a result, the finish rolling temperature was lowered to 850–800 °C. Another measure causing the retardation of austenite grain growth was the application of the titanium technology. Titanium in CHQ steels protects boron against the formation of boron nitride BN. However, a very fine distribution of TiN particles can substantially retard the kinetics of recrystallization and grain growth following the recrystallization [11]. Thus, a very fine distribution of austenite grains is obtained in the wire rod after rolling at CMC Poland, with size not exceeding 25 μm (Fig. 1).
The reduction of austenite grain size affects phase transformations and its positive influence is reflected in the wire rod’s performance during drawing and cold forging operations, and the final microstructure and properties of fasteners.
Generally, lower austenite grain size speeds up the kinetics of phase transformation, which leads to an increase of the rate of phase transformations latent heat release. This necessitated the adjustment of the cooling conditions in the CMC Poland Stelmor line. This part of the investigation was performed by applying the numerical modelling of phase transformations.
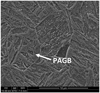 |
Fig. 1 Fine grains in the wire rod with a diameter of Ø12.5 mm in the 32CrB4 steel. Forced cooling at a rate of 5 °C/s at 850–500 °C was applied in the Stelmor line. SEM. (PAGB − prior austenite grain boundary). |
4 Experimental methodology
The chemical composition of the investigated 32CrB4 steel is presented in Table 1. The data for the model identification were generated during dilatometric investigations performed using the DIL 805 A/D/T deformation dilatometer. This method relies on the measurement of the sample’s dilations caused by the occurrence of phase transformations [12]. The tests were performed with Ø5 mm × 10 mm samples. The temperature changes during the tests were monitored by means of a thermocouple spot welded to the samples’ surface at half-height. S-type (PtRh10-Pt) thermocouples with a 0.1 mm diameter were used for this purpose. Prior to the cooling stage, the samples were subjected to a deformation sequence reproducing the deformation conditions of the rolling process.
Dilatometric constant cooling rate tests were performed to supply data for the identification of the phase transformation model. TTT diagrams are used by some researchers [13,21]. The reasons that CCT diagrams were applied are twofold. The first is connected with the fact that massive samples were used and they were deformed before the cooling process. For these samples, it would be difficult to achieve high cooling rates to reach isothermal temperature, which are necessary to perform TTT tests. In consequence, the ferritic transformation can begin before reaching isothermal temperature, what can cause errors in experimental data. Ferritic transformation may be launched directly after the end of deformation. The second reason for using CCT diagrams is connected with the fact that an algorithm which allows the identification of the phase transformation model on the basis of constant cooling rate experiments, could be used. This algorithm is described in [14,15] and an example of its practical application can be found in [16].
Metallographic samples were prepared after each test by grinding and polishing with diamond paste. The investigation was carried out at a distance of approximately 0.2 mm from the spotted thermocouple. Microstructure observations were carried out with an optical and digital Olympus DSX500i microscope and with high-resolution scanning electron microscope (SEM) − JSM-7200F produced by Jeol. The samples were etched with 3% nital. The quantitative measurement of the surface fraction of the samples’ microstructural constituents was performed with the Metilo program [17].
Chemical composition of the 32CrB4 steel, wt%.
5 Phase transformation model description
The characterisation of phase transformations occurring in steels is most frequently performed using the dilatometric method. However, obtained results of dilatometric investigations cannot directly be transferred into the conditions of the Stelmor line. In dilatometric tests, a constant cooling rate is maintained which, in general, is against the physics of the cooling process. Moreover, to maintain the constant cooling rate, the dilatometer control system attenuates the heat generated due to the occurrence of the phase transformations (latent heat of transformations). Therefore, the correct application of the dilatometric investigation results into the Stelmor process requires the development of the phase transformations model which can be applied to different and varying cooling conditions.
The model is based on the classical JMAK equation:
 (1)
(1)
where X − volume fraction of a new phase, t − time, k, n − coefficients.
The development and identification of the phase transformation model for the 32CrB4 steel and the application of this model to simulations of the cooling of rods in the Stelmor system was the objective of the work. The model should allow for a precise prediction of the cooling parameters, which provide the targeted microstructure of the wire rods after cooling. Therefore, an upgrade of the JMAK model described in [18] was applied.
Phase transformations modelling is based on the equilibrium diagram, and the model describes the kinetics of the transient state between two states of the equilibrium [19]. The modification of the JMAK model, which noticeably improved the accuracy and reliability of the predictions, included the modification of equations describing the incubation time and coefficient (k) in equation (1). The incubation time was not introduced in the case of the ferritic transformation, and it was assumed that this transformation begins when 5% of ferrite is obtained. The Avrami coefficient for ferrite (kf ) is calculated as [20]:
 (2)
(2)
where Dγ − austenite grain size, T − temperature in °C, and
 (3)
(3)
The modification of equations describing incubation time (τp ) and Avrami coefficient (kp ) for pearlitic transformation, as well as incubation time (τb ) and Avrami coefficient (kb ) for bainitic transformation are calculated as follows:
 (4)
(4)
 (5)
(5)
 (6)
(6)
 (7)
(7)
The introduction of the modified Gauss function in the k(T) relation was the main modification. This function allowed reproducing the C-shape of the isothermal transformation curve. The exponential functions, which were originally used in [19], provided a continuous increase of the rate of transformation with decreasing temperature, which is not physical. The remaining equations in the model include:
Martensite start temperature:
 (8)
(8)
Martensite volume fraction [21]:
 (9)
(9)
where Ff, Fp, Fb, Fm, − volume fractions of ferrite, pearlite, bainite and martensite.
Coefficient a 20 in equation (6) represents the bainite start temperature. During the simulation of the ferritic transformation, the carbon concentration in the austenite is calculated as:
 (10)
(10)
where c 0–carbon content in steel.
The numerical predictions of phase transformations using the equations above require the knowledge of the equilibrium phase boundary’s location. A part of the phase equilibrium diagram, which was calculated using the ThermoCalc software [22], is presented in Figure 2. The equilibrium carbon concentrations were approximated using the following equations:
 (11)
(11)
where cγα − carbon concentration in austenite at the γ-α interface, cγβ − carbon concentration in austenite at the γ-cementite interface, cγα 0, cγα 1, cγβ 0, cγβ 1–coefficients which were determined on the basis of the ThermoCalc results. These coefficients are given in Table 2.
 |
Fig. 2 Part of the Fe-Fe3C diagram for steel 32CrB4. |
6 Results of the investigation
6.1 Dilatometry
The input parameters for the identification of the phase transformation model coefficient include the phase transformation start and finish temperatures, as well as fractions of microstructural constituents as function of cooling rate. These parameters were measured in the experiments conducted using the DIL 805 dilatometer. The experiments were composed of three stages: heating to 1080 °C and holding, cooling combined with two deformations, and cooling at a constant cooling rate to ambient temperature (Fig. 3). The maximum heating temperature corresponds to the applied soaking temperature of ingots in the heating furnace during wire rod rolling at the CMC Poland rolling mill. The deformation parameters were adjusted to obtain the austenite grain size after the last deformation in the range of 15–20 μm. This corresponds to the austenite grain size obtained during industrial thermomechanical rolling in the industrial process. Prior to the experiments described in Figure 3, the critical temperatures for the 32CrB4 steel were determined by heating the sample to 1000 °C at a rate of 2.5 °C/s. The determined temperatures were: Ac 1 = 734 °C, Ac 3 = 795 °C.
The obtained phase start and finish temperatures for the applied cooling rates obtained in the dilatometric experiments are given in Table 3, and the results of the fraction of microstructural constituent measurements are given in Table 4.
The measured fractions of microstructural constituents are presented in Figure 4 and the examples of the microstructures obtained in the dilatometric samples are presented in Figures 5–8. In these figures, the same description of microstructural constituents was applied as in Tables 2 and 3. The results of the measurements show that up to a cooling rate of around 0.5 °C/s the microstructure is composed of ferrite and pearlite. Moreover, an increase in the cooling rate causes a slight increase of the pearlite volume fraction. This means that the so-called diluted pearlite forms at higher cooling rates. From the practical point of view, the most important feature of the developed model is its capability to accurately predict the threshold cooling rates for obtaining the desired microstructure in 32CrB4 wire rods. Figure 4 shows that the maximum volume fraction of bainite occurs in the microstructure of the wire rod after cooling at a rate of around 2 °C/s.
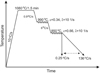 |
Fig. 3 Schematic diagram illustrating the deformation conditions applied during dilatometric investigation. |
Phase transformation start and finish temperatures obtained in dilatometric experiments (F stands for ferrite, P stands for pearlite, B stands for bainite, M stands for martensite, s and f stand for start and finish, respectively).
Fraction of microstructural constituents (Ff − ferrite, Fp − pearlite, Fb − bainite, Fm − martensite) in the dilatometric samples subjected to cooling at different rates.
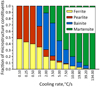 |
Fig. 4 Dependence of the fraction of microstructural constituents of dilatometric samples as a function of cooling rate. |
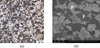 |
Fig. 5 Microstructure of dilatometric sample after cooling at a rate of 0.5°C/s; (a) LOM; (b) SEM. |
 |
Fig. 6 Microstructure of dilatometric sample after cooling at a rate of 1.0°C/s; (a) LOM; (b) SEM. |
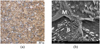 |
Fig. 7 Microstructure of dilatometric sample after cooling at a rate of 5.0°C/s; (a) LOM; (b) SEM. |
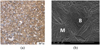 |
Fig. 8 Microstructure of dilatometric sample after cooling at a rate of 7.5 °C/s; (a) LOM; (b) SEM. |
6.2 Phase transformations model identification and validation
The model contains several coefficients, which were grouped in vector a. An inverse algorithm developed by the Authors of [14] was applied in the identification procedure. The adaptation of this algorithm to the dilatometric tests is described in [15]. The results of the CCT tests were used in the objective function:
 (12)
(12)
where wT, wF − weighting factors, Tm , Tc − measured and calculated start and end temperatures of phase transformations in the CCT tests, Fm , Fc − measured and calculated volume fractions of phases, k, l − number of temperatures and volume fractions, respectively.
Weighting factor wT = 0.9 was used for the temperatures and wF = 0.1 for volume fractions. The coefficients in all models were determined by searching for the minimum of the objective function (12) with respect to confidents a. These optimal coefficients are given in Table 5.
The model was verified by the comparison of measured and calculated start and end temperatures for the phase transformations in the CCT tests. The results of this comparison are shown in Figure 9a. In all figures in this report F stands for ferrite, P for pearlite, B for bainite and M for martensite. Beyond pearlitic transformation, a very good agreement between the measurements and the calculations was obtained. Since the goal was to manufacture wire rods with ferritic-bainitic microstructure, less attention was paid to pearlite. Due to the problems with reproducing the start and end transformation temperatures for pearlite, the weighting factors were decreased for this transformation. The measured and calculated volume fractions of phases were compared as well, and the results are shown in Figure 9b.
Coefficients in the phase transformation model for the 32CrB4 steel.
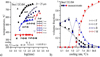 |
Fig. 9 Measured (filled symbols) and calculated (empty symbols) start and end temperatures of transformations (a) and volume fractions of phases (b) for the 32CrB4 steel. |
6.3 Model validation in industrial conditions
Simulations of the cooling of a 32CrB4 steel wire rod with a diameter of Ø12.5 mm in the industrial Stelmor process were performed to assess the sensitivity of the developed model to varying cooling conditions. Three cases were considered:
Standard cooling under covers with a rate of around 0.5 °C/s;
Transient cooling at a rate of 0.8 °C/s leading to the formation of small amounts of bainite;
Fast cooling at rates intended to maximise the fraction of bainite in the wire rod’s microstructure.
The second variant is aimed at verifying the developed model’s capability to identify the critical cooling rate at which bainite occurs in the wire rod’s microstructure. From industrial practice, it is known that due to the variation of the 32CrB4 steel composition, the critical cooling rate for bainite formation is about 0.55 °C/s, which is well seen in Figure 10, where a zoom for a small range of cooling rates is presented.
During the industrial experiments, the temperature of the wire rod was monitored using an infrared camera and for reference the set of pyrometers located along the Stelmor conveyor. The temperature profiles at the loop centre were used for the phase transformation numerical simulations. The results for the standard cooling of the wire rod under cover at the rate of 0.5 °C/s, and for comparison with a rate of 0.8 °C/s, as well as accelerated cooling intended to develop predominantly bainitic microstructure in the wire rod were considered for model validation. Figure 11 shows a comparison of the kinetics of phase transformations and Figure 12 shows fractions of microstructural constituents for the three investigated cases.
During industrial trials, a cooling rate of around 0.5 °C/s was achieved by using covers over the Stelmor conveyor and adjusting the conveyor’s speed. An increase in the cooling rate to around 0.8 °C/s was achieved by increasing the conveyor’s speed. The accelerated controlled cooling conditions were achieved by adjusting the cooling rates by the proper calculated setting capacity of the fans to limit the ferrite and martensite formation, and the fans were stopped when the coil reached a temperature of around 400 °C to limit the ferrite and martensite formation, and at the same time to obtain th maximum fraction of bainite.
The obtained microstructures of the wire rod after applying both cooling variants are shown in Figures 13−15.
The measured and calculated fractions of microstructural constituents are given in Table 6. The presented results demonstrate a very good capability of the developed phase transformation model to quantitatively predict the effect of cooling conditions on the phase transformation kinetics in the wire rod cooled in the Stelmor process.
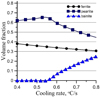 |
Fig. 10 Volume fractions of phases as a function of cooling rate close to the critical cooling rate for bainite occurrence. |
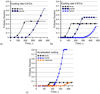 |
Fig. 11 Comparison of the kinetics of phase transformations for the standard cooling with the rates of 0.5 °C/s (a) and 0.8 °C/s (b) and for accelerated cooling (c). |
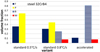 |
Fig. 12 Volume fractions of structural components for standard cooling with a rate of 0.5 °C/s and for accelerated cooling. |
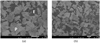 |
Fig. 13 Microstructure of dilatometric sample after cooling at a rate of around 0.5°C/s; (a) subsurface area; (b) core area; SEM. |
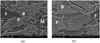 |
Fig. 14 Microstructure of dilatometric sample after cooling at a rate of around 0.8°C/s; (a) subsurface area; (b) core area; SEM. |
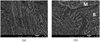 |
Fig. 15 Microstructure of dilatometric sample after accelerated cooling; (a) subsurface area; (b) core area; SEM. |
Measured and calculated fractions of microstructural constituents obtained in the wire rod during the industrial experiment.
7 Discussion
The Stelmor system used in CMC Poland allows precise control of the temperature during cooling of wire rods. This feature will further be used to develop the technology of wire rod production characterized by complex phase structures, with prospective application to the production of fasteners without applying additional heat treatment operations. The main feature of these structures is that they do not contain pearlite, and bainite is the leading constituent. To develop cooling strategies aimed at obtaining the complex phase structures in the wire rod, a more robust approach is required than an intuitive analysis of the CCT diagram. Therefore, an accurate and reliable model of phase transformations was developed to translate the time-temperature profiles into the resulting microstructural compositions of the products. The modified JMAK model was applied in the present work. The modification comprised the introduction of coefficient k in the JMAK equation as a function of temperature. A modified Gauss function was used for all diffusive transformations, which allowed to reproduce a typical C-shape of the isothermal transformations’ curves. The application of the inverse solution for the results of the dilatometric tests allowed to obtain a very good accuracy of the model. The developed model is capable of predicting the required cooling conditions to develop different types of microstructural constituents. This is seen in Figures 9 and 12. The dependence of bainite volume fraction on the cooling rate is of special interest. Figure 9 shows that bainitic transformation in the 32CrB4 steel starts at a cooling rate slightly higher than 0.5 °C/s, and the volume fraction of bainite increases as the cooling rate increases till approximately 2.7 °C/s. Further increase of the cooling rate leads to a fast decrease of bainite volume fraction in the microstructure, however, this constituent is present in the microstructure even if high cooling rates are applied. It is noteworthy that this scenario is valid for austenite having a mean grain size of 25 μm. Since the developed model accounts for austenite grain size, the effect of grain size on phase transformation kinetics and the resulting structure can also be accounted for.
The experimental part of the research using dilatometry was performed by applying constant cooling rate conditions. However, the development of a complex phase microstructure in the wire rod will require varying cooling conditions in the Stelmor process. The capability of predicting the kinetics of phase transformations under varying cooling conditions was achieved by applying the additivity rule.
8 Conclusions
The modified JMAK model was successfully applied to numerically calculate the effect of cooling conditions in the CMC Poland Stelmor process to obtain the targeted microstructure of the 32CrB4 steel wire rod.
To improve the accuracy of currently applied models, a modified Gauss function was used for all diffusive transformations, what allowed to reproduce a typical C-shape of the isothermal transformations’ curves.
The developed model allows a transfer of dilatometric tests’ results into industrial conditions. The direct application for this purpose of commonly used CCT or DCCT diagrams is not justified, since constant cooling rates are applied for the development of these diagrams.
By using the phase transformation model, an inverse algorithm was developed, capable of adjusting the cooling conditions in the CMC Poland Stelmor line to obtain the targeted microstructure of the wire rod. This algorithm will be used for further development of the wire rod characterised by DP or TRIP assisted microstructure.
Acknowledgements
This paper and research was created with the support financed by European Funds − Smart Growth (European Union − European Regional Development Fund) grant number POIR.01.02.00-00-0159/16.
References
- M. Okonogi, K. Yamazaki, Development of medium carbon steel wire rods for cold heading by isothermal transformation treatment, Nip. Ste. Sum. Met. Tech. Rep.116, 65–70 (2017) [Google Scholar]
- M.S. López-Cornejo, H.J. Vergara-Hernández, S.A. Arreola-Villa et al., Numerical simulation of wire rod cooling of eutectoid steel under forced-convention, Metals 11. 224 , 1–13 (2021) [Google Scholar]
- I. Jain, S. Lenka, S.K. Ajmani et al., An approach to heat transfer analysis of wire loops over the stelmor conveyor to predict the microstructural and mechanical attributes of steel rods, J. Therm. Sci. Eng. Appl. 8 , 1–11 (2016) [CrossRef] [Google Scholar]
- E. Anelli, Application of mathematical modelling to hot rolling and controlled cooling of wire rods and bars, ISIJ Int. 32 , 440–449 (1992) [CrossRef] [Google Scholar]
- J.K. Hwang, The temperature distribution and underlying cooling mechanism of steel wire rod in the Stelmor type cooling process, Appl. Therm. Eng. 142 , 311–320 (2018) [CrossRef] [Google Scholar]
- P.C. Campbell, E.B. Hawbolt, J.K. Brimacombe, Microstructural engineering applied to the controlled cooling of steel wire rod: Part I. Experimental design and heat transfer, Metall. Mater. Trans. A 22A , 2769–2778 (1991) [CrossRef] [Google Scholar]
- P.C. Campbell, E.B. Hawbolt, J.K. Brimacombe, Microstructure engineering applied to the controlled cooling of steel wire rod: Part 2. Microstructural evolution and mechanical properties correlations, Metall. Mater. Trans. A 22A , 2779–2790 (1991) [CrossRef] [Google Scholar]
- P.C. Campbell, E.B. Hawbolt, J.K. Brimacombe, Microstructural engineering applied to the controlled cooling of steel wire rod: Part 3. Mathematical model-formulation and predictions, Metall. Mater. Trans. A 22A , 2791–2805 (1991) [CrossRef] [Google Scholar]
- R. Esterl, M. Sonnleitner, R. Schnitzer, Microstructural analysis of the recrystallization behaviorof low alloyed steels, Steel Res. Int. 90 , 1–10 (2019) [Google Scholar]
- R. Kuziak, S. Zajac, R. Kawalla et al., Cold heading quality low–carbon ultra–high strength bainitic steels. Final Report, RFCS Project No. RFSR-CT-2005-00031 (2008) [Google Scholar]
- K. Matsumoto, K. Tsukada, S. Yamamoto et al., Effect of Titanium on metallurgical and mechanical properties of controlled rolled steels, Tetsu-to-Hagane 74 , 107–114 (1988) [CrossRef] [Google Scholar]
- J. Opara, W. Zalecki, Dilatometric and metallographic studies for verifying phase transformations mesoscale model, J. Metall. Mater. 70 , 32–39 (2018) [Google Scholar]
- M. Irani, S. Chung, M. Kim et al., Adjustment of isothermal transformation diagrams using finite-element optimization of the Jominy test, Metals 10 , 931 (2020) [CrossRef] [Google Scholar]
- M. Pietrzyk, L. Madej, L. Rauch et al., Computational Materials Engineering: Achieving high accuracy and efficiency in metals processing simulations, Elsevier, Butterworth-Heinemann, Amsterdam, 2015 [Google Scholar]
- L. Rauch, D. Bachniak, R. Kuziak et al., Problem of identification of phase transformation models used in simulations of steels processing, J. Mater. Eng. Perform. 27 , 5725–5735 (2018) [CrossRef] [Google Scholar]
- M. Pietrzyk, J. Kusiak, R. Kuziak et al., Conventional and multiscale modelling of microstructure evolution during laminar cooling of DP steel strips, Metall. Mater. Trans. B 46B , 497–506 (2014) [Google Scholar]
- J. Szala, Metilo, authorized program, version 12.01a, Silesian University of Technology, Institute of Materials Science, Katowice. (2015) [Google Scholar]
- D. Bachniak, R. Kuziak, D. Szeliga et al., Mean field model of phase transformations in steels during cooling, which predicts evolution of carbon concentration in the austenite, Metall. Res. Technol. 118 , 411 (2021) [CrossRef] [EDP Sciences] [Google Scholar]
- M. Pietrzyk, R. Kuziak, Modelling phase transformations in steel, in J. Lin, D. Balint, M. Pietrzyk, Microstructure evolution in metal forming processes, Woodhead Publishing, Oxford, 2012, pp. 145–179 [CrossRef] [Google Scholar]
- B. Donnay, J.C. Herman, V. Leroy et al., Microstructure evolution of C-Mn Steels in the hot deformation process: the STRIPCAM model, in J.H. Beynon, P. Ingham, H. Teichert, K. Waterson, H. Pircher, Proc. 2nd Conf. Modelling of Metal Rolling Processes, London, 1996, pp. 23–35 [Google Scholar]
- D.P. Koistinen, R.E. Marburger, A general equation prescribing the extent of the austenite-martensite transformation in pure iron-carbon alloys and plain carbon steels, Acta Metall. 7 , 59–69 (1959) [CrossRef] [Google Scholar]
- J.O. Andersson, T. Helander, L. Höglund et al., Computational tools for materials science, Calphad 26 , 273–312 (2002) [CrossRef] [Google Scholar]
Cite this article as: Michal Piwowarczyk, Natalia Wolańska, Maciej Pietrzyk, Lukasz Rauch, Roman Kuziak, Wladyslaw Zalecki, Phase transformation model for adjusting the cooling conditions in Stelmor process to obtain the targeted structure of thermomechanically rolled wire rod used for fastener production, Metall. Res. Technol. 119, 517 (2022)
All Tables
Phase transformation start and finish temperatures obtained in dilatometric experiments (F stands for ferrite, P stands for pearlite, B stands for bainite, M stands for martensite, s and f stand for start and finish, respectively).
Fraction of microstructural constituents (Ff − ferrite, Fp − pearlite, Fb − bainite, Fm − martensite) in the dilatometric samples subjected to cooling at different rates.
Measured and calculated fractions of microstructural constituents obtained in the wire rod during the industrial experiment.
All Figures
|
Fig. 1 Fine grains in the wire rod with a diameter of Ø12.5 mm in the 32CrB4 steel. Forced cooling at a rate of 5 °C/s at 850–500 °C was applied in the Stelmor line. SEM. (PAGB − prior austenite grain boundary). |
| In the text | |
|
Fig. 2 Part of the Fe-Fe3C diagram for steel 32CrB4. |
| In the text | |
|
Fig. 3 Schematic diagram illustrating the deformation conditions applied during dilatometric investigation. |
| In the text | |
|
Fig. 4 Dependence of the fraction of microstructural constituents of dilatometric samples as a function of cooling rate. |
| In the text | |
|
Fig. 5 Microstructure of dilatometric sample after cooling at a rate of 0.5°C/s; (a) LOM; (b) SEM. |
| In the text | |
|
Fig. 6 Microstructure of dilatometric sample after cooling at a rate of 1.0°C/s; (a) LOM; (b) SEM. |
| In the text | |
|
Fig. 7 Microstructure of dilatometric sample after cooling at a rate of 5.0°C/s; (a) LOM; (b) SEM. |
| In the text | |
|
Fig. 8 Microstructure of dilatometric sample after cooling at a rate of 7.5 °C/s; (a) LOM; (b) SEM. |
| In the text | |
|
Fig. 9 Measured (filled symbols) and calculated (empty symbols) start and end temperatures of transformations (a) and volume fractions of phases (b) for the 32CrB4 steel. |
| In the text | |
|
Fig. 10 Volume fractions of phases as a function of cooling rate close to the critical cooling rate for bainite occurrence. |
| In the text | |
|
Fig. 11 Comparison of the kinetics of phase transformations for the standard cooling with the rates of 0.5 °C/s (a) and 0.8 °C/s (b) and for accelerated cooling (c). |
| In the text | |
|
Fig. 12 Volume fractions of structural components for standard cooling with a rate of 0.5 °C/s and for accelerated cooling. |
| In the text | |
|
Fig. 13 Microstructure of dilatometric sample after cooling at a rate of around 0.5°C/s; (a) subsurface area; (b) core area; SEM. |
| In the text | |
|
Fig. 14 Microstructure of dilatometric sample after cooling at a rate of around 0.8°C/s; (a) subsurface area; (b) core area; SEM. |
| In the text | |
|
Fig. 15 Microstructure of dilatometric sample after accelerated cooling; (a) subsurface area; (b) core area; SEM. |
| In the text | |
Current usage metrics show cumulative count of Article Views (full-text article views including HTML views, PDF and ePub downloads, according to the available data) and Abstracts Views on Vision4Press platform.
Data correspond to usage on the plateform after 2015. The current usage metrics is available 48-96 hours after online publication and is updated daily on week days.
Initial download of the metrics may take a while.