| Issue |
Metall. Res. Technol.
Volume 120, Number 5, 2023
|
|
|---|---|---|
| Article Number | 509 | |
| Number of page(s) | 9 | |
| DOI | https://doi.org/10.1051/metal/2023067 | |
| Published online | 03 October 2023 | |
Original Article
Kinetics of static recrystallization in Sn-added Fe-Si alloys
1
Arts et Métiers Institute of Technology, MSMP, HESAM Université, 59000, Lille, France
2
Aix-Marseille University, Institut Matériaux Microélectronique Nanosciences de Provence-IM2NP, UMR CNRS, 7334, France
3
Arcelor Mittal Global R&D Gent, Pres. J.F. Kennedylaan 3, 9060 Zelzate, Belgium
* Corresponding author: This email address is being protected from spambots. You need JavaScript enabled to view it.
Received:
6
June
2023
Accepted:
7
September
2023
Abstract
Segregated solute atoms play an important role in grain boundary migration phenomena, which are critical for understanding the microstructure evolution in metals. Recrystallization kinetics of Fe-Si-Sn alloys were experimentally studied during static recrystallization. An established physical model that couples recovery and recrystallization was implemented to describe the experimental observations. The model was extended to include microstructural input, while taking into account the solute drag effect. The model is able to predict both the evolution of the recrystallized fraction and hardness after annealing in the temperature range [773K;1023K] for binary (Fe-5.8at. %Si) and ternary (Fe-5.8at. %Si-0.045at. % Sn) alloys.
Key words: Solute drag / recovery / recrystallization / modelling / Fe-Si alloys
© M. Dumont et al., Published by EDP Sciences, 2023
 This is an Open Access article distributed under the terms of the Creative Commons Attribution License (https://creativecommons.org/licenses/by/4.0/), which permits unrestricted use, distribution, and reproduction in any medium, provided the original work is properly cited.
1 Introduction
Development of alloys involving complex chemistry and thermomechanical processes requires a deep understanding of the coupling of microstructural phenomena to lead to the desired microstructure and then expected properties [1,2]. Deformation processes increase the internal energy of the material through the storage of dislocations and increasing interface areas. Such energy will be released during subsequent annealing by restoration mechanisms, such as recovery or recrystallization. Recrystallization occurs through the discontinuous nucleation of new grains, free of dislocations and their subsequent growth. Such mechanism is thermally activated and depends on the degree of stored energy and the mobility of grain boundaries. Chemistry, in particular solute atoms and precipitates, plays a key role in grain boundary migration, either by decreasing mobility by solute drag, arising from the segregation of solute atoms on the moving grain boundary, or by reducing the driving force by Zener pinning due to the presence of precipitates which act as obstacles to the migration of the interface [3,4].
In this paper, the effect of Sn addition on recrystallization kinetics after cold rolling is investigated in Fe-Si steels. In such alloy, solute atoms are not prone to precipitation, so solute drag effect can be isolated. Moreover, recovery cannot be avoided during annealing. Consequently, modelling of recrystallization kinetics requires accounting for recovery to estimate the remaining driving force for recrystallization. Previous studies focused on Sn segregation during recovery [5] and recrystallization [6] in an Fe-Si-Sn alloy. From these results, a recrystallization model is applied, which links recovery and recrystallization, and accounts for microstructural heterogeneity as input as well as solute drag effect. The results of the kinetic model are compared to experimental data obtained on Fe-Si-Sn alloys annealed at temperatures between 773K and 1023K after cold rolling.
2 Materials and experimental
For investigating the Sn effect on recrystallization kinetics, two lab processed Fe-Si based model alloys were investigated, one alloy with 5.8 at. % Si (binary) and another with 5.8 at. % Si and 0.045at. % Sn (ternary). Impurities were limited to a total amount of about 150 at. parts per million. Si is added to stabilize α-Fe and produce a single-phase alloy to study recrystallization only under the solute effect. Both Si and Sn concentrations are within the solid solubility values in α-Fe. The materials were lab processed in ArcelorMittal Global R&D Gent, with a final cold rolling step at a Von Mises true strain of about ε = 2. Materials in the as-deformed (‘full hard’) state were subjected to a static recrystallization annealing at temperature between 773K and 1023K in a DIL805bD BÄHR dilatometer. For all the heat treatments, a heating rate of 25K s−1 was applied to reach the isothermal temperature. Following the isothermal step, samples were quenched to room temperature.
For subsequent characterization, samples underwent the typical preparation for metallography, including mechanical grinding, polishing with diamond suspensions and finish with fine polishing using colloidal silica suspension with particle size of 0.04 μm. Recrystallization fractions were determined in the annealed microstructures via quantitative metallography by applying the point count method performed in the RD-ND cross-sections. Hardness measurements were performed by Vickers micro-hardness (HV) tests on the RD-ND cross-section of the materials to quantify the softening fraction during restoration. A relatively small applied load of 50 g was used, as it was more sensitive to microstructural features than higher ones (such as 200–500 g). At least 9 indentations were applied at each condition from which the average value was taken. HV measurements were performed at room temperature after the samples had been subject to various heat treatments in the dilatometer.
3 Results and discussion
3.1 Experimental observations relevant for modelling
In a previous study, the as-deformed microstructure was thoroughly investigated and shown to be basically constituted of two mains textures ‘families’, designated as the high stored energy (HSE) regions and the low stored energy (LSE) [5]. HSE regions, with {111}〈uvw〉 orientation, contain dense shear bands to accommodate plastic deformation while LSE regions, around {001}〈110〉 orientation of the α-fibre, contain coarser sub grain structure and lower misorientations. Stored energy is linked to dislocation density and represents the basic driving force for restoration phenomena. It is known that stored energy is orientation dependent [7]. Figure 1 displays the dislocation density as a function of grain orientation in the as-deformed microstructure evaluated by EBSD. There is quite a difference in dislocation density as grain orientation changes from LSE to HSE regions. These regions of the as-deformed microstructure essentially reflect the extremes (minimum and maximum) in internal dislocation density and should exhibit very different recrystallization kinetics during annealing. Finally, it was stated in [5] that the as-deformed state does not vary significantly between the binary and the ternary alloys.
Figure 2 shows micrographs of partially recrystallized microstructures after interrupted annealing for the two studied alloys. Recrystallized fractions and hardness measured after different times of annealing at 973K are displayed in Figure 3 for both the binary and ternary alloys. As expected by solute drag theory, Sn addition induces a retardation of the recrystallization kinetics (see Fig. 3a). In the hardness curve (Fig. 3b), it clearly appears that softening begins before the recrystallization start. This is attributed to recovery, followed by a sharp drop when recrystallization starts. Consequently, the dislocation densities at the origin of the recrystallization are expected to be decreased due to preceding recovery phenomenon.
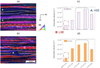 |
Fig. 1 As-deformed microstructure from EBSD showing HSE ‘A’ and LSE ‘B’ regions in the (a) binary and (b) ternary alloys. The corresponding dislocation density calculated as a function of grain orientation from the EBSD data is shown (c) for the binary and (d) for the ternary alloys. |
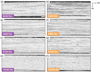 |
Fig. 2 Optical micrographs through-thickness at different stages of static recrystallization after interrupted annealing cycles at the dilatometer for (a-d) binary and (e-h) ternary alloys. |
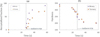 |
Fig. 3 Evolution of the recrystallized fraction (a) and of the hardness (b) after annealing at 973K. |
3.2 Modelling approach
A modelling approach is developed, for static recovery and recrystallization, accounting for the major elements arising from experimental observations: 1. binary and ternary alloys have comparable initial microstructures; 2. the initial microstructure (‘as-deformed’) is not homogeneous but can be split into HSE and LSE regions with different initial dislocation densities; 3. dislocation density evolves before the onset of recrystallization due to recovery; 4. Sn addition induces solute drag, causing retardation in the recrystallization kinetics.
The model is based on the approach developed by Zurob et al. [2] assuming the Johnson-Mehl-Avrami-Kolmogorov (JMAK) type of kinetics with site saturation. The version of the model used here is developed and described by Philippot et al. [8] and later Bellavoine et al. [4], accounting only for the solute drag effect. The extended recrystallized volume fraction is expressed as:
 (1)
(1)
where NREX is the number of nucleation sites for recrystallization per unit volume, ΔE(t) is the driving force for recrystallization which decreases with time and M(T, XSn) is the grain boundary mobility of the recrystallization front, dependent on temperature T and segregation of Sn.
Concerning the driving force component, it derives from the stored energy of plastic deformation which is generally expressed as:
 (2)
(2)
with ρ being the dislocation density, G the shear modulus of ferrite matrix and b the burgers vector. In this treatment, the initial dislocation densities for HSE and LSE calculated from EBSD data analysis given in Mavrikakis et al. [5] are used as input parameters. The evolution of the dislocation density during recovery is evaluated by using Verdier’s model [9], as already detailed in [5]. In this model, the evolution of flow stress is described thanks to the following expression:
 (3)
(3)
where Uα and Vα are the activation energy and activation volume of the recovery process assumed to be independent of temperature and composition. Then vd and E are the Debye frequency and Young’s modulus, respectively. σFR is the flow stress of the fully recrystallized state.
In the non-recrystallized regions, flow stress is related to the dislocation density by considering the forest type hardening relationship:
 (4)
(4)
where MT is the Taylor factor and αrec is the dislocation–dislocation junction strength.
Concerning the mobility, it is of course dependent on the temperature but also on alloying as Sn atoms decrease the mobility according to the so-called solute drag effect. The effect of solute drag during the migration of grain boundaries has been described by Cahn [10], its effect on boundary mobility is expressed as:
 (5)
(5)
where Mpure is the grain boundary mobility of the system without the solute effect (in this case Mpure is taken for the case of the binary alloy) and αmob a mobility parameter which is constant with velocity and representative of the amplitude of solute drag.
 (6)
(6)
 (7)
(7)
where XSn is the concentration of Sn in atomic fraction, NV is the number of atoms per unit volume, λ is the grain boundary width of the moving boundary, E0 is the binding energy between grain boundary (at the centre of the interface) and solute atom. Dtrans is the transinterface diffusion coefficient of Sn atoms.  ,
,  are the pre-exponential factors andQgb, Qtrans the activation energy for grain boundary migration and trans interface diffusion respectively. VFe is the molar volume of ferrite.
Finally, the hardness evolution during annealing can be evaluated by considering that the extra-hardening (ΔHV = HV-HVFR where HV is the hardness and HVFR the hardness in the fully recrystallized state) in the ‘full hard’ state and subsequent annealing is due to forest type dislocation strengthening mechanism in the non-recrystallized regions. This extra-hardening can be estimated thanks to the recovery model that gives access to the dislocation density. Hardness and flow stress can be related by using the empirical equation proposed by experimental observations in ferritic steels from Busby et al. [11] compiling data found in literature. According to these authors, the yield stress correlates with hardness as follows σ = 3.06 ∙ HV. So finally, hardness is estimated as follows:
 (8)
(8)
3.3 Microstructural input
In order to account for the different behaviour of HSE and LSE regions of the microstructure, the modelled system is separated into two sub-systems. The HSE and LSE regions are assumed to differ in their initial dislocation density, as illustrated in Figure 4. Values of the initial dislocation densities and respective fractions of HSE and LSE regions in both alloys were determined in a previous study, all details about the determination methods and reported values can be found in [5]. The relevant values used as input data about the microstructural initial state are reported in Table 1. Different Taylor factors MT are also considered (see Tab. 2). The behaviour of the global system is calculated as the summation of each sub-system weighted by the volume fraction of each region, 50% HSE (fHSE) and 50% LSE (fLSE) for both binary and ternary alloys.
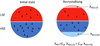 |
Fig. 4 Schematic of the microstructural system separation between HSE and LSE regions. |
Input data about the initial material microstructure.
Summary of all parameters used in the modelling approach.
3.4 Model parameters
Most of the parameters were extracted from the literature. For fitting parameters (in bold in Tab. 2), the range of values reported in the literature is given in Table 2. The fitting of the parameters was done with the following strategy (see Fig. 5). First, the recovery parameters (Uα, Vα and αrec) were determined. Secondly the mobility parameters involved in Mpure ( and Qgb) were fitted on the binary alloy. Finally, the Sn solute drag effect was determined using the E0 determined in a previous study [5], whereas the Dtrans parameters (Dtrans and Qtrans) were fitted on the ternary alloy.
Parameters used for the recovery model, in particular Uα, Vα and αrec, were fitted on hardness measurements obtained at 773 and 823K, temperatures lower than the recrystallization temperature for both grades. Hardness results from the recovery model as compared to experimental data are displayed in Figure 6.
Regarding the mobility model, both diffusion coefficients ( and Dtrans) were considered as fitting parameters, the first fitted on the binary alloy and the second on the ternary alloy. Moreover, the binding energy E0 was evaluated through the Cahn’s theory dealing with the solute concentration profile at the vicinity of a migrating interface as compared to Sn concentration profile measured in the ternary alloy by atom probe tomography. More details about this can be found in [6].
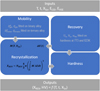 |
Fig. 5 Schematic of the modelling approach showing inputs, outputs and fitting parameter strategy. |
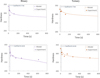 |
Fig. 6 Hardness data used for fitting of the recovery model for the binary and ternary alloys annealed at 773 and 823K starting from the ‘full hard’ condition. |
3.5 Comparison with experimental data
Figure 7 compares the experimental and modelled recrystallization kinetics, both for the binary and ternary alloys annealed at 873, 923, 973 and 1023K. The modelling clearly accounts for Sn retardation effect on recrystallization kinetics. Moreover, measured hardness and hardness evaluated by the recovery model are also displayed. The results, recrystallization fraction and hardness, obtained are in very good agreement with the experimental measurements over the whole investigated range of temperatures, both for the binary and ternary alloys.
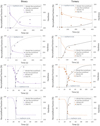 |
Fig. 7 Recrystallization kinetics: comparison of experimental and modelling results for binary and ternary alloys annealed at 873, 923, 973 and 1023K. |
3.6 Discussion
The recovery model allows to take into account the decrease in stored energy for the competing recrystallization processes. Figure 8 illustrates the contribution to the softening of each of the sub-regions of the system: recrystallized and non-recrystallized regions of the LSE and HSE areas. The softened fraction was calculated as follows:
 (9)
(9)
where HFH is the hardness in the ‘full hard’ as-deformed state, H(t) is the current hardness and HFR is the hardness in the fully recrystallized (or full soft) state.
This model is satisfying in terms of overall quantitative description of the recovery and recrystallization kinetics over a wide temperature range, from 773 to 1023K, in spite of simplifying assumptions. In particular, the present model assumes that the two sub-systems (HSE and LSE regions) recrystallize independently. However, it was shown in another study [16] that this can be considered as correct for the ternary alloy, whereas in the binary alloy, strain induced boundary migration (SIBM) clearly occurs from HSE toward LSE regions. This means that HSE and LSE regions are not independent sub-systems. However, this assumption does not affect so much recrystallization kinetics but is fundamental in the development of recrystallization textures in these systems.
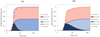 |
Fig. 8 Softened fraction R at 973K for the binary (a) and the ternary (b) alloys: contribution of the different sub-regions, recrystallized (rex) and non-recrystallized (unrex) in both LSE and HSE regions as compared to the global experimental data. |
4 Conclusions
The current study proposed a model able to deal with recovery and recrystallization processes acting simultaneously, applied to an Fe-Si and an Fe-Si-Sn alloy in which the solute effect is acting on the boundary mobility by exerting solute drag. Moreover, the system can be divided into two subsystems differing by their initial stored energy (LSE and HSE regions) as a result of the cold rolling process. The parameters of the model are numerous but can be evaluated successively for each process: recovery parameters fitted at low temperature, recrystallization parameters in the binary system and finally solute drag on the ternary alloy. The results of the model give satisfactory results as compared to experimental data.
Acknowledgements
N.M. is grateful for the financial support of the National Association of Research and Technology (ANRT − Project no. 1073–2015).
References
- M.H.F.J. Humphreys, Recrystallisation and related annealing phenomena, 2nd ed., Elsevier Ltd, 2004 [Google Scholar]
- H.S. Zurob, C.R. Hutchinson, Y. Bréchet et al., Modeling recrystallization of microalloyed austenite: effect of coupling recovery, precipitation and recrystallization, Acta Mater. 50, 3077–3094 (2002) [CrossRef] [Google Scholar]
- C. Hutchinson, H. Zurob, C. Sinclair et al., The comparative effectiveness of Nb solute and NbC precipitates at impeding grain-boundary motion in Nb steels, Scr. Mater. 59, 635–637 (2008) [CrossRef] [Google Scholar]
- M. Bellavoine, M. Dumont, J. Drillet et al., Combined effect of heating rate and microalloying elements on recrystallisation during annealing of dual-phase steels, Metall. Mater. Trans. A. 49, 2865–2875 (2018) [CrossRef] [Google Scholar]
- N. Mavrikakis, C. Detlefs, P.K. Cook et al., A multi-scale study of the interaction of Sn solutes with dislocations during static recovery in α-Fe, Acta Mater. 174, 92–104 (2019) [CrossRef] [Google Scholar]
- N. Mavrikakis, W. Saikaly, D. Mangelinck et al., Segregation of Sn on migrating interfaces of recrystallisation: quantification through APT measurements and comparison with the solute drag theory, Mater. 9, 100541 (2020) [Google Scholar]
- I.L. Dillamore, H. Katoh, The mechanisms of recrystallization in cubic metals with particular reference to their orientation-dependence, Met. Sci. 8, 73–83 (1974) [CrossRef] [Google Scholar]
- C. Philippot, M. Bellavoine, M. Dumont et al., Influence of heating rate on ferrite recrystallization and austenite formation in cold-rolled microalloyed dual-phase steels, Met. Mater.Trans. A 49A, 66–77 (2018) [CrossRef] [Google Scholar]
- M. Verdier, Y. Brechet, P. Guyot, Recovery of AlMg alloys: flow stress and strain-hardening properties, Acta Mater. 47, 127–134 (1998) [CrossRef] [Google Scholar]
- J.W. Cahn, The impurity-drag effect in grain boundary motion, Acta Metall. 10, 789–798 (1962) [CrossRef] [Google Scholar]
- J.T. Busby, M.C. Hash, G.S. Was, The relationship between hardness and yield stress in irradiated austenitic and ferritic steels, J. Nucl. Mater. 336, 267–278 (2005) [CrossRef] [Google Scholar]
- B. Bacroix, J. Schneider, A. Franke, Evolution of recrystallization texture in non-oriented electrical steels during final annealing − influence of shear stress after cold rolling, J. Phys.: Conf. Ser. 1270, 012007 (2019) [CrossRef] [Google Scholar]
- F. Arieta, C. Sellars, Activation volume and activation energy for deformation of Nb HSLA steels, Scr. Metall. Mater. 30, 707–712 (1994) [CrossRef] [Google Scholar]
- C.W. Sinclair, C.R. Hutchinson, Y. Bréchet, The effect of Nb on the recrystallisation and grain growth of ultra-high-purity α-Fe: a combinatorial approach, Metall. Mater. Trans. A. 38, 821–830 (2007) [CrossRef] [Google Scholar]
- P.O. Rossi, C.M. Sellars, Quantitative metallography of recrystallisation, Acta Mater. 45, 137–148 (1997) [CrossRef] [Google Scholar]
- N. Mavrikakis, W. Saikaly, P.R. Calvillo et al., How Sn addition influences texture development in single-phase Fe alloys: correlation between local chemical information, microstructure and recrystallisation, Mater. Charact. 190, 112072 (2022) [CrossRef] [Google Scholar]
Cite this article as: Myriam Dumont, Nikolas Mavrikakis, Wahib Saikaly, Dominique Mangelinck, Kinetics of static recrystallization in Sn-added Fe-Si alloys, Metall. Res. Technol. 120, 509 (2023)
All Tables
All Figures
|
Fig. 1 As-deformed microstructure from EBSD showing HSE ‘A’ and LSE ‘B’ regions in the (a) binary and (b) ternary alloys. The corresponding dislocation density calculated as a function of grain orientation from the EBSD data is shown (c) for the binary and (d) for the ternary alloys. |
| In the text | |
|
Fig. 2 Optical micrographs through-thickness at different stages of static recrystallization after interrupted annealing cycles at the dilatometer for (a-d) binary and (e-h) ternary alloys. |
| In the text | |
|
Fig. 3 Evolution of the recrystallized fraction (a) and of the hardness (b) after annealing at 973K. |
| In the text | |
|
Fig. 4 Schematic of the microstructural system separation between HSE and LSE regions. |
| In the text | |
|
Fig. 5 Schematic of the modelling approach showing inputs, outputs and fitting parameter strategy. |
| In the text | |
|
Fig. 6 Hardness data used for fitting of the recovery model for the binary and ternary alloys annealed at 773 and 823K starting from the ‘full hard’ condition. |
| In the text | |
|
Fig. 7 Recrystallization kinetics: comparison of experimental and modelling results for binary and ternary alloys annealed at 873, 923, 973 and 1023K. |
| In the text | |
|
Fig. 8 Softened fraction R at 973K for the binary (a) and the ternary (b) alloys: contribution of the different sub-regions, recrystallized (rex) and non-recrystallized (unrex) in both LSE and HSE regions as compared to the global experimental data. |
| In the text | |
Current usage metrics show cumulative count of Article Views (full-text article views including HTML views, PDF and ePub downloads, according to the available data) and Abstracts Views on Vision4Press platform.
Data correspond to usage on the plateform after 2015. The current usage metrics is available 48-96 hours after online publication and is updated daily on week days.
Initial download of the metrics may take a while.