Open Access
Fig. 9
Download original image
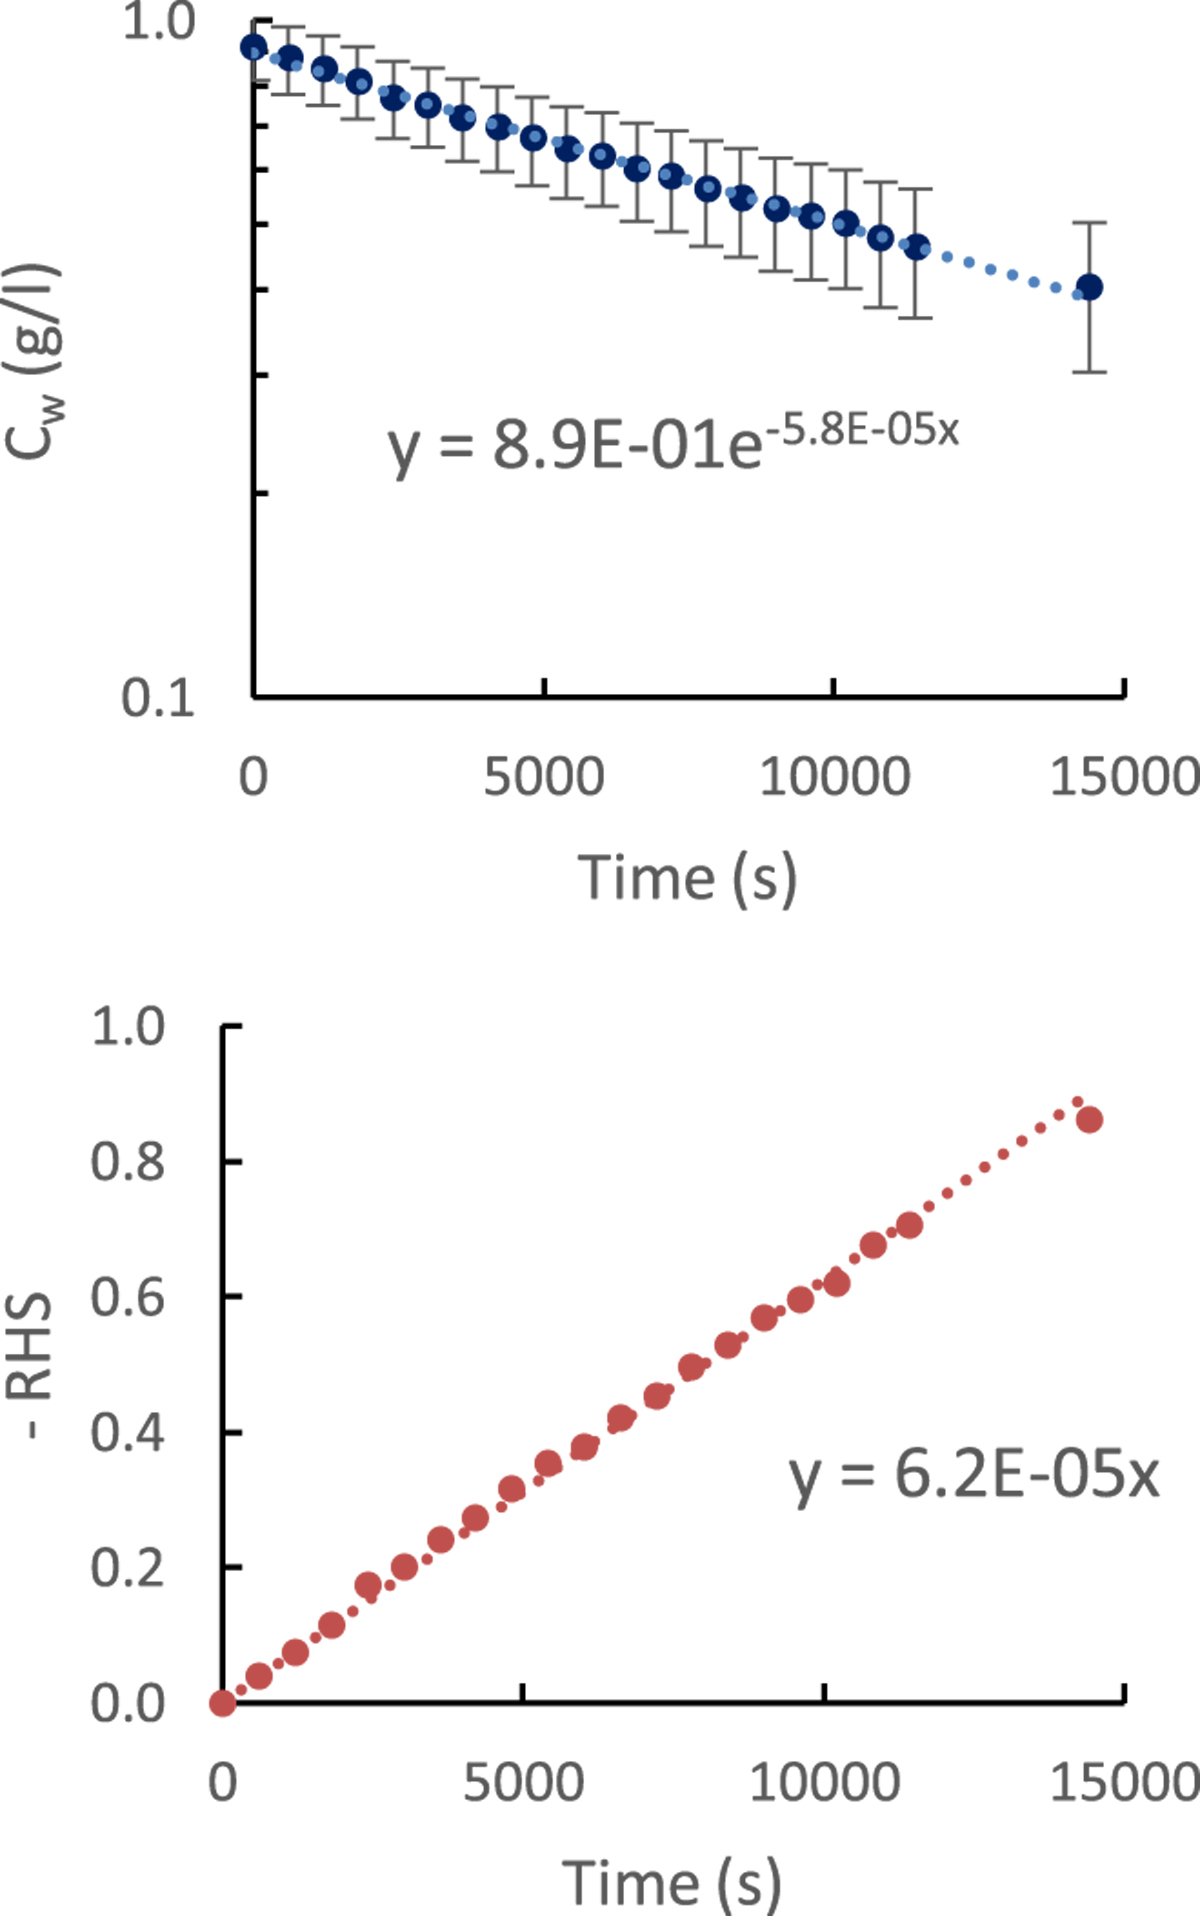
Top: Time evolution of the concentration of thymol in water at Q=2.5 l/min and dinj=7.9 mm. The error bars correspond to the measurement errors (cf. Supplementary Material: Fig. 1). Bottom: Time evolution of minus the right-hand side of (16) obtained with Q=2.5 l/min and dinj=7.9 mm.
Current usage metrics show cumulative count of Article Views (full-text article views including HTML views, PDF and ePub downloads, according to the available data) and Abstracts Views on Vision4Press platform.
Data correspond to usage on the plateform after 2015. The current usage metrics is available 48-96 hours after online publication and is updated daily on week days.
Initial download of the metrics may take a while.