Open Access
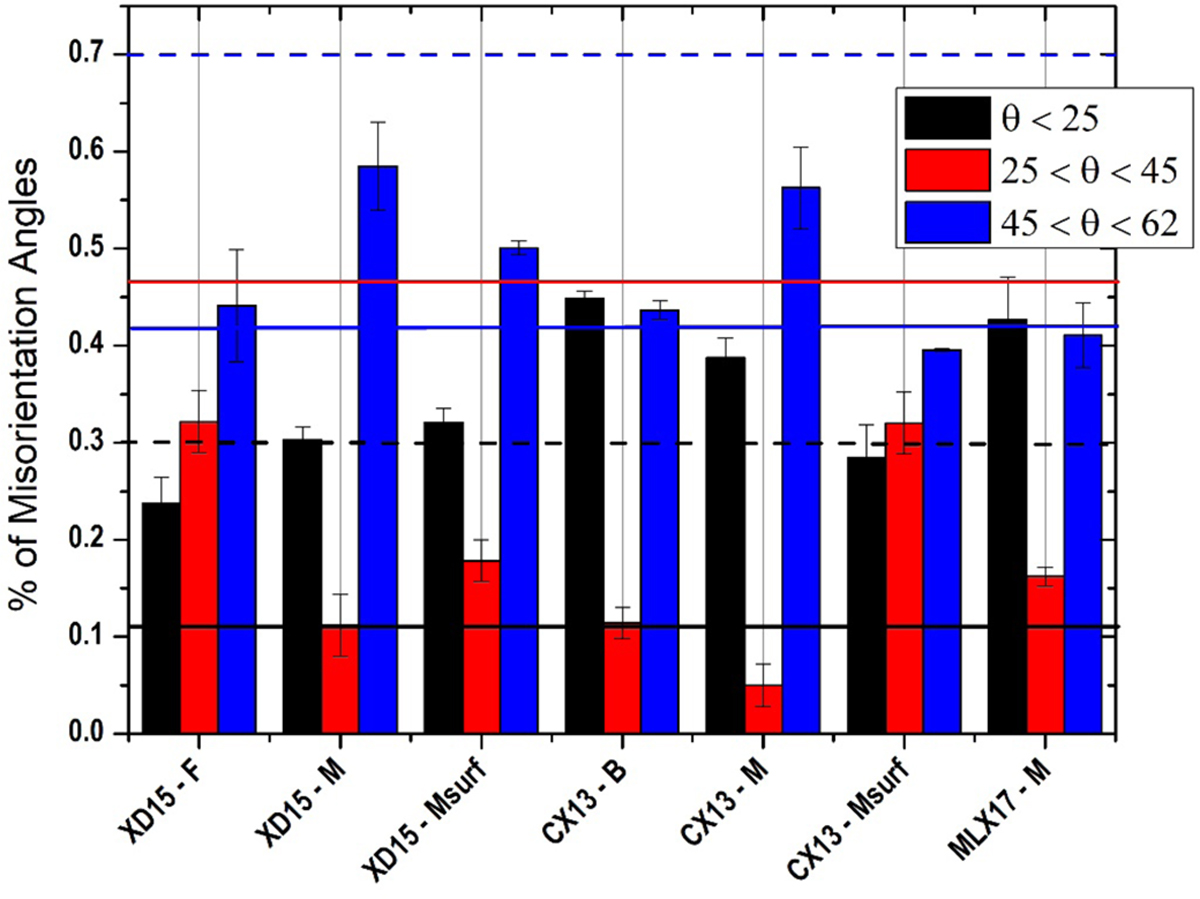
Fig. 8
Download original image
Percentages of low, intermediate and high misorientations found in the various investigated maps. The error bar corresponds to the standard deviation. The dashed lines correspond to the values associated with only KS misorientations and the solid lines correspond to the values found in a random orientation distribution.
Current usage metrics show cumulative count of Article Views (full-text article views including HTML views, PDF and ePub downloads, according to the available data) and Abstracts Views on Vision4Press platform.
Data correspond to usage on the plateform after 2015. The current usage metrics is available 48-96 hours after online publication and is updated daily on week days.
Initial download of the metrics may take a while.