| Issue |
Metall. Res. Technol.
Volume 119, Number 5, 2022
|
|
|---|---|---|
| Article Number | 523 | |
| Number of page(s) | 13 | |
| DOI | https://doi.org/10.1051/metal/2022079 | |
| Published online | 21 September 2022 | |
Regular Article
Influence of laser powder bed fusion processing parameters on corrosion behaviour of 316L stainless steel in nitric acid
1
Université Paris-Saclay, CEA, Service de la corrosion et du comportement des matériaux dans leur environnement, 91191 Gif-sur-Yvette, France
2
Université Paris-Saclay, CEA, Service d’Etudes Analytiques et de Réactivité des Surfaces, 91191 Gif-sur-Yvette, France
* e-mail: This email address is being protected from spambots. You need JavaScript enabled to view it.
** e-mail: This email address is being protected from spambots. You need JavaScript enabled to view it.
Received:
4
March
2022
Accepted:
24
August
2022
Abstract
The effect of process parameters on the microstructure and corrosion behavior of additively manufactured 316L stainless steel was reported. Immersion tests were performed in nitric acid solution at boiling temperature and the corrosion behaviour was correlated to microstructure of 316L stainless steel specimens produced by laser powder bed fusion (L-PBF) as a function of the process parameters such as scanning strategy, laser power and hatching distance. These parameters were found to influence the porosity, the grain size and the cellular microstructure. The corrosion tests revealed a higher impact of hatching distance on corrosion behaviour. Post-mortem microstructural examination revealed that the corrosion preferentially occurred at cellular structures and at grain boundaries and melt pools when the scanning strategy and hatching distance were respectively modified. The solute segregation at boundaries cells, the grain size distribution and the porosity could explain this corrosion behaviour. The results were compared with those of solution annealed counterpart, which would provide a factual basis for future applications of L-PBF 316L stainless steel.
Key words: additive manufacturing / corrosion / laser powder bed fusion / microstructure / nitric acid / process parameters / stainless steel
© B. Puga et al., Published by EDP Sciences, 2022
 This is an Open Access article distributed under the terms of the Creative Commons Attribution License (https://creativecommons.org/licenses/by/4.0/), which permits unrestricted use, distribution, and reproduction in any medium, provided the original work is properly cited.
1 Introduction
In recent years, additive manufacturing (AM) processes have become a key innovation technology in the field of materials manufacturing. These processes not only allow the elaboration of complex geometries with improved properties but also offer optimised solutions considering a circular economy approach. In other words, the possibility to optimise the design of parts according to the industrial application, to produce complex design in less time, to reduce the quantity of raw materials and to repair components directly on industrial sites leads to a reduction of greenhouse gas emissions as well as to a reduction of the use of scarce materials [1]. One of the most attractive and popular AM methods, within the Laser Beam Melting methods (LBM), is laser powder bed fusion (L-PBF) due to relatively wide raw powder availability, remarkable flexibility in design, capability to produce near net-shape complex components as well as cost and time savings [2]. However, the rapid heating and fast cooling rates coupled with thermal cycling involved in these AM processes generate specific microstructures different from those of cast or wrought alloys. Stainless steels (SS) produced by L-PBF, more specifically the AISI 316L austenitic SS, display fine grains, columnar grain of austenite with intercellular segregation of Mo and Cr, fusion boundaries, dislocations, precipitates mostly rich with Si, O and Mn, atomic scale impurities (for example N and H) and internal residual stresses [3–8]. These inherent conditions also cause metallurgical defects, such as porosity due to unmelted powders and gas entrapment and rough surface [9–12]. All these specificities of microstructure and metallurgical state of L-PBF 316L SS, which depend on manufacturing parameters [13], can have a beneficial or detrimental impact on the corrosion behaviour of materials.
Several works have been dedicated to study the effect of L-PBF parameters, specially laser power and laser scanning speed, on the porosity and the pitting corrosion of the 316L specimens. Even though their pitting corrosion susceptibility seems to increase as a function of the porosity, their corrosion resistance is still higher than that of specimens prepared using conventional manufacturing methods [14–17]. The L-PBF process can induce different precipitates chemistry in comparison to that obtained in classical processes, which enhance resistance to pit initiation. However, the accumulation of chloride ions inside the pores could increase the probability of oxide layer breakdown and affect the pit repassivation. Other recent reports have demonstrated that the presence of high density of dislocations associated to fast scanning speed induces localized corrosion. These regions of high density of dislocations have been correlated to spatial variations in the local Cr concentration and the formation of complex Mn7C3 nanoinclusions [18]. Kale et al. have also reported that scanning strategy may modify the porosity and grain size distribution of 316L samples and consequently, the electrochemical behavior of these samples [19].
Although studies have started to link the process parameters to the microstructure and the corrosion behaviour of 316L SS produced by L-PBF, they are still scarce and do not cover in depth all the parameters influencing corrosion. In addition, most of them consider exclusively the corrosion behaviour in chloride containing environments and use a relatively short testing period (less than 24 h). Indeed, the same SS can present different corrosion morphologies and durability depending on the aggressive environment to which it is exposed.
The objective of the present study was to analyse and correlate the impact of the different L-PBF parameters, mainly laser power, scanning strategy and hatching distance, on the microstructure and corrosion behaviour of the 316L SS produced by L-PBF in nitric acid at boiling temperature. These oxidizing conditions, which lead to a shift of the corrosion potential toward the transpassive domain of SSs, where intergranular corrosion can develop [20], were chosen in order to highlight the role of grain size, cellular structures and the solute segregation at grain and cellular boundaries. To this end, an optical and scanning electron microscopy characterization was first carried out, revealing microstructural features characteristic from each process parameter and then, immersion tests and post-mortem microstructural examinations were conducted, assessing mass loss kinetics and corrosion morphologies. This work tries to give more information about the process parameters that can play a significant role in corrosion performance, since the control of these parameters will be essential to be able to control and optimize the corrosion behaviour.
2 Material and methods
2.1 Raw material
Argon-atomised spherical 316L SS powder supplied by TRUMPF GmbH was used. The powder is characterized by spherical particles with only a small amount of satellites and rod-like particles as shown in Figure 1.
Particle size measured by granulometer Partica using the Fraunhofer laser diffraction method vary from 20 to 40 μm and the D10, D50 and D90 are 20.6, 28.3 and 39.5 respectively. The apparent density measured according to the standard ASTM B212 is 4.39 ± 0.01 g/cm3. Moreover, flow properties, determined by Densitap device provided by GranuloShop showed an interesting flowability of the powder. Major elements were quantified by inductively coupled plasma optical emission spectrometry (ICP-OES), minor elements by glow discharge mass spectrometry (GD-MS) and gas elements by instrumental gas analysis (IGA) EMGA-820 analyser.
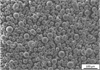 |
Fig. 1 SEM micrograph of the raw 316L SS powder showing the spherical particles. |
2.2 Process parameters
The L-PBF experiments are conducted on a TruPrint series 1000 L-PBF machine (TRUMPF GmbH), equipped with a 200 W Yb-fiber laser (λ = 1.064 μm) and a Gaussian beam spot of 55 μm diameter. The consolidation process is performed under argon atmosphere with an imposed oxygen concentration lower than 100 ppm during the process to avoid oxidation and impurity contamination. The powder bed feed rate is fixed to 20 μm per layer. Parallel lines using bidirectional vectors are used as scanning direction. The samples consolidated by L-PBF process were cubes of 10 mm side and rectangular samples of 20 mm × 30 mm × 1.5 mm.
In L-PBF, the processing parameters are usually combined in a volumetric energy density (E) defined by equation (1):
 (1)
(1)
where P is the laser power (W), V is the scan speed (mm. s−1), HD is the hatch distance (mm) and t is layer thickness (mm) [21].
The process parameters usually used for producing the dense 316L steel are: P = 150 W, V = 675 mm/s and HD = 55 μm. As part of this work, we widen the range of each of these parameters: the laser power range from 70 to 200 W and the hatching distance (HD) from 30 to 90 μm. Altogether, twelve parameter combinations with different laser power and HD were studied (Tab. 1). The volumetric energy densities range between 94 and 370 J/mm2.
The set scanning strategy was 5 mm2 islands with a rotation of 90°, 45° or 15° between each island (Fig. 2).
Processing parameters for L-PBF process, Trumpf TruPrint 1000 Series printer.
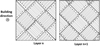 |
Fig. 2 Schematic of the laser scanning strategy for two consecutive layers (n and n + 1) showing the 90° rotation between each island. |
2.3 Microstructural characterizations
The theoretical densities are measured thanks to a helium pycnometer. Particles size distributions are determined thanks to a granulometer Partica LA-950 from Horiba®. The morphology of the powder is examined using a JEOL 7000F scanning electron microscope (SEM). Oxygen content of each powder are measured thanks to the inert gas fusion method using a Horiba® EMGA 820 AC analyser.
The L-PBF builds are analyzed in the as-grown conditions. The density of each sample is measured thanks to Archimedes’ method. The measures are repeated twice for each sample. Specimens are then prepared for optical and SEM observations. Cross-sectional samples are polished following the standard metallographic procedures with a final polishing step using a 40 nm colloidal silica suspension in order to reveal the microstructure. SEM images are obtained thanks to a JEOL 7000F field emission gun (FEG) machine operating at 15 kV in backscattered electron (BSE) mode.
Microstructural observations were carried out employing an optical microscope (OM) Zeiss Axio Imager, a scanning electron microscope (SEM) Jeol JSM-7000F. Grain orientation and grain size were determined by electron backscattered diffraction (EBSD) integrated on the SEM. Grains morphologies have been statistically measured from EBSD maps thanks to ImageJ software on a 50 sampling base. Specimens were etched in aqua regia during 5 seconds prior being polished with 1 μm diamond paste to obtain a mirror-like surface finish for metallographic characterizations with OM and SEM. For EBSD analysis, samples were ultra-polished with colloidal silica. X-Ray Diffraction (XRD) measurements where conducted using a Brücker D8 Advance diffractometer (Bragg–Brentano θ–2θ geometry, CuKα radiation λ =1.54060 Å) with 2θ ranging from 20° up to 100° (scan speed of 0.020°/s).
2.4 Corrosion tests
2.4.1 Materials
Corrosion tests were performed using L-PBF 316L SS and reference 316L SS rectangular samples of 20 mm ×30 mm × 1.5 mm. The reference 316L SS samples were obtained from a solution annealed (labelled SA from now on) and pickled 316L stainless steel, in the form of a cold-rolled plate. Its nominal composition is given in Table 2. Prior to analysis, these samples were polished to 320 grit SiC finish and cleaned with ethanol an acetone in an ultrasonic bath, rinsed in distilled water and dried with compressed air.
Nitric acid (R. P. NORMAPUR PROLABO 52.5%) and deionized water (18.2 MΩ cm) were used to prepare the electrolytic solution.
Reference 316L SS composition (in weight %).
2.4.2 Immersion tests
L-PBF 316L SS and reference 316L SS samples were immersed for 5 cycles of 48 h in 2 L of 8 M HNO3 at boiling temperature. The solution was renewed after each corrosion period (48 h) in order to avoid a high concentration of corrosion products in the solution. To estimate the mass loss kinetics as a function of time, the sample was removed from the electrolyte to be weighted every 48 h. Firstly, it was rinsed for 30 min with demineralized water and dried with compressed air. Then it was stored in a desiccator at 22 ± 1.5 °C for at least 45 min. Finally, it was weighted with a balance XP205 from Mettler Toledo. Three samples of each type were exposed in the solution to ensure reproducible results.
At the end of immersion test, the corroded surfaces and the cross sectional samples were examined using a SEM (Leo 1450 VP Zeiss or Ultra 55 Zeiss) and EBSD integrated on the SEM Jeol JSM-7000F.
3 Results and discussion
3.1 Raw material characterization
The as-received Trumpf powder chemical composition is listed in Table 3. The latter meets the RCC-MRx code requirements in terms of chemical composition for 316L used in nuclear field [22]. XRD results (Fig. 3) confirm a fully γ-austenite 316L SS powder with a face-centered cubic structure with a lattice parameter of 3.596 ± 0.001 Å.
Chemical composition of the 316L SS powder and RCC-MRx code requirements.
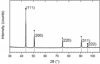 |
Fig. 3 X-ray diffraction Ɵ-2Ɵ scan of the 316L SS Trumpf powder showing the first five (hkl) peaks of the pure austenitic phase (▪). |
3.2 Influence of process parameters on the microstructure
3.2.1 Porosity
Figure 4 describes the evolution of the density of the 316L steel cubes as a function of the energy density applied. Over the energy density interval [168–278 J/mm3], the samples density of the cubes remains almost constant and greater than 7.92 g/cm3 (relative density > 99%). Similar density values obtained on 316L steel parts manufactured by L-PBF are mentioned in the literature [23].
A volume density of 202 J/mm3 (P = 150 W, V = 675 mm/s, and HD of 55 μm) leads to the best experimental density of 316L steel produced by L-PBF, i.e. 7.93 ± 0.01 g/cm3.
Below 168 J/mm3, the density of the samples decreases. The energy deposited is not sufficient to fuse all the powder particles and consolidate parts without forming porosities. This lack of fusion is visible in Figure 5a for the sample produced with an energy density of 101 J/mm3. The densest sample (Ev = 202 J/mm3) is presented in Figure 5b for comparison. For the least dense sample, many porosities are distributed homogeneously in the matrix. They are mostly irregular in shape and elongated perpendicular to the direction of construction. They testify to a lack of fusion of the powder particles in “layer n” during the passage of the laser beam causing the formation of pores between the layers n and n + 1. Their sizes can reach a hundred microns for the least dense sample and ten microns for the densest material.
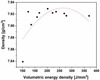 |
Fig. 4 Density of the parts produced by L-PBF as a function of the volumetric energy density (J/mm3). |
 |
Fig. 5 Optical micrographs at different magnification of parts produced by L-PBF as a function of the volumetric energy density: (a) 101 J/mm3 and (b) 202 J/mm3. |
3.2.2 Grain size
The evolution of the grain size as a function of the two study parameters: power and HD are represented in Figure 6. The variation of each of these two parameters causes a modification of the grain size. For the reference parameters leading to the high dense 316L steel, the length and width of the grains are equal to 46 μm and 19 μm respectively.
The grains length increases with power. Increasing the power from 75 W to 200 W results in a larger grain size. The grain length thus goes from 27 μm to 57 μm (+30 μm) and the width from 15 to 21 μm (+6 μm).
The increase in power implies a higher energy density Ev . According to this study, energy density is the main parameter that drives grain morphology thus the aspect ratio (length/width). The thermal gradient at the solid / liquid interface is the major factor controlling columnar grain growth [24]. The higher the density of energy deposited, the deeper the heat affected area. As a result, the thermal gradient stretches over a wider depth, which leads to the formation of more and more columnar grains.
Decreasing HD also amounts to increasing the energy density Ev . As with the power and speed of the scan, we expect a magnification of the grains when the HD decreases. However, it is not the case. According to Figure 6b, when the HD decreases from 90 to 30 μm, which means an increase of volumetric energy density from 123 to 370 J/mm3, the grain size decreases. The grains length decreases from 59 μm to 39 μm and the width from 24 to 17 μm.
Figure 7 presents the EBSD images of the grains for an HD of 30 μm and 90 μm, i.e. an energy density of 370 and 123 J/mm3 respectively. We clearly see the difference in grain size between the two parameters. The grains are smaller and less columnar when the distance between two successive laser lines is 30 μm (Fig. 7a). The closer the laser lines, the greater the overlap of the fusion baths. A local re-melting of more than half of the melt (approximately 70%) takes place for an HD of 30 μm (Fig. 8a).
A fusion bath is therefore remelted successively at least three times. The iterative process of melting/solidification of the same melt pool reduces the stability of the solid/liquid interface, which alters the thermal gradient which does not have time to propagate along the direction of construction. The thermal gradient at the solid/liquid interface is therefore disturbed. It is lower when the HD used is 30 μm, which explains the formation of finer and less columnar grains along the construction direction. On the contrary, when the HD is 90 μm, the overlap between two neighboring melt pools represents less than 10% (Fig. 8b). The thermal gradient at the solid/liquid interface oriented along the construction direction is therefore less altered by remelting thus having the time to propagate from the bottom to the top of the part. The grains are thus larger and columnar for an HD equal to 90 µm (Fig. 7b).
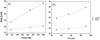 |
Fig. 6 Grain size according to L-PBF parameters (a) laser power (V and HD fixed) and (b) HD (P and V fixed). |
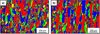 |
Fig. 7 EBSD images showing the grain size for (a) Ev = 370 J/mm3 (HD = 30 μm) and (b) Ev =123 J/mm3 (HD = 90 μm). |
 |
Fig. 8 Optical Micrographs illustrating the overlap of the melt pools for (a) Ev = 370 J/mm3 (HD = 30 μm) and (b) Ev = 123 J/mm3 (HD = 90 μm). |
3.2.3 Cellular microstructure
The evolution of the size of the sub-micrometric cells as a function of the two parameters, power and HD, is shown in Figure 9. The variation of each of these two parameters generates a significant modification of the size cells.
The cell size is 450 nm for the reference parameters leading to the densest steel. The size of the cells increases with power. It increases from 376 to 559 nm when the laser power goes from 75 W to 200 W (Fig. 9a). The variation in HD results in a slight change in cell size compared to a change in scanning power or speed. By increasing the HD from 30 to 90 μm, the diameter of the cells decreases from 491 to 432 nm (Fig. 9b).
The energy density increases as power increases and HD decreases. The previous results therefore confirm that an increase in the volumetric energy density leads to a growth in cell size. However, the size of this substructure is controlled by the speed of solidification [25–27]. The size of this cell structure decreases with the speed of solidification. According to the study by Ma et al. [28], the size of cells λ is related to the speed of solidification V sol by equation (2). Increasing the volume density of energy therefore makes it possible to decrease the speed of solidification, which leads to the formation of an increasingly coarse substructure.
 (2)
(2)
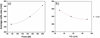 |
Fig. 9 Average cells size according to L-PBF parameters (a) laser power (V and HD fixed) and (b) HD (P and V fixed). |
3.2.4 Texture
The analyzed samples are textured <110> according to the building direction Z in all the samples as shown in Figure 10. They have a texture of the α fiber type as illustrated in Figure 10 with different texture intensities.
The trend of the curve is similar to that representing the grain size as a function of the energy density (Fig. 11). The texture <110> along the construction direction is stronger when the grains are columnar. The grain size is tailored by the thermal gradient. The higher the energy density, the higher the thermal gradient, which favors the formation of columnar and textured grains along the construction direction. This observation is true except for the variations of HD. This last parameter in fact alters the thermal gradient due to the iterative reflow of the fusion baths. The higher the HD (the lower the energy density), the larger and less textured the grains.
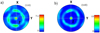 |
Fig. 10 Pole figure <110> along the Z direction (a) Ev = 123 J/mm3 and b) Ev = 340 J/mm3. |
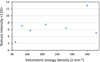 |
Fig. 11 Texture intensity along <110> as a function of the volumetric energy density (J mm−3). |
3.3 Effects of process parameters on the corrosion behaviour
3.3.1 Steady state mass loss rate
To evaluate the weight loss, the samples were periodically removed from the oxidizing solution. The weight loss is initially (within 48 h) high and then it remains more or less constant, showing a linear weight loss curve. Assuming linear kinetics after 48 hours, and thus a uniform corrosion process, the corrosion rate (μm/year) can be estimated using the equation (3):
 (3)where Δm is the weight loss variation in g, ρ is the density in g/ cm3, S is the area of exposure in cm2 and Δt is the time of exposure in days. In the case that specimens are attacked non-uniformly, the calculated corrosion rates indicate only the relative severity of attack.
The effect of the laser parameters (given by Eq. (1)) on the corrosion rates of L-PBF 316L SS specimens is presented in Figure 12. Lowest corrosion rate value (46 ± 12 μm/year) is observed when the volume energy density of 236 J/mm3 (P = 175W, V = 675 mm/s and HD of 55 μm) was applied. Similar corrosion rate value (48 ± 4 μm/year) is obtained on reference 316L SS. Despite the microstructure of these samples is different, the corrosion rate is comparable. Below 236 J/mm3, the corrosion rate tends to increase, reaching values of the order of 74 ± 17 μm/year. According to the evolution of density as a function of the volume energy density, samples with lower density exhibited a higher corrosion rate. The presence of porosity distributed homogeneously in the matrix could have a detrimental effect on corrosion resistance. At higher volume energy density (>236 J/mm3) associated with small HD values, higher corrosion rate and standard deviation values are obtained (i.e. 125 ± 22 μm/year for 370 J/mm3). The high standard deviation indicates the dispersion of corrosion behavior between three samples elaborated at different time.
Figure 13 shows the influence of each parameter (HD, laser power and scanning strategy) on the corrosion rate. It was observed that the samples prepared with the lowest HD (30 and 40 μm) were found to have the highest corrosion rate (>100 μm/year) than the other parameters (Fig. 13a). In contrast, increasing the HD until 60 μm, the corrosion rate remained almost comparable to reference 316L SS. For an HD of 70 and 90 μm, the corrosion rate tends to slightly increase. The same trend was found when the laser power was modified (Fig. 13b). The corrosion rate of the specimens decreased with increasing laser power, when the laser scan speed was kept fixed at 675 mm/s, HD at 55 μm and the laser power varied from 70 to 175 W. Above 175 W, the corrosion rate increased again. These results suggested that microstructures with finer and less columnar grains along the construction direction could have a detrimental effect on corrosion resistance in hot nitric acid. It can be seen in Figure 13c that the scanning strategy modified slightly the corrosion rate. For a rotation of 45° between each island, the specimen showed better corrosion resistance in comparison with reference 316L SS. By contrast, there was no specific effect between the corrosion behavior and the scanning rate; these results have not been reported here.
To understand the corrosion mechanism of these samples, the corroded samples were examined using SEM and EBSD analysis. Figures 14a–14d shows SEM observations of the surface morphologies of L-PBF samples after 240 h of immersion in 8 mol/L nitric acid at boiling temperature. In this work, only the L-PBF specimens of each parameter, which presented a highest corrosion rate than that reference 316L SS, have been illustrated. Two kinds of corrosion morphologies can be observed as a function of process parameters. Cellular structures were preferentially attacked when scanning strategy and laser power were modified (Figs. 14a–14c). This attack was also found in the samples where high HD was applied. On the contrary, corrosion occurred at grain boundaries and melt pools when lowest HD were applied (Fig. 14d). Figure 14b shows that the equiaxed cells, which are localized in the transverse direction of the growth larger columnar grains [29], were preferentially attacked when the scanning strategy and laser power were modified. This corrosion could be attributed to different chemical composition between the cell boundaries, which were segregated with elements such as Cr, Ni and Mo [29–32], and the cell itself, which was rich in Fe [3]. Indeed, the formation of micro-galvanic couples has been previously reported in the literature. Kong et al. showed that the potential at cell boundaries was higher than that in the inner cell [33]. This means that the Cr and Mo rich areas behave as cathodes and the Fe rich areas as anodes, which promotes the preferential dissolution of Fe inside the cell. Taking into account that the cells size increases with power, this could lead to a modification of anode/cathode area ratio and, as a result, enhancing corrosion behavior. Indeed, in the case of small anode/cathode area ratio, the galvanic current is concentrated onto a small anodic area. Fast dissolution of anode tends to occur under these conditions. In contrast, we have observed that the cluster of cells, which are localized in the parallel direction of the growth columnar grain, remained intact because only cell boundaries, which have a homogeneous composition [34], were exposed to nitric acid.
Although the growth direction of the cluster of cells is influenced by the scanning strategy linked to temperature gradient [29], no differences were evidenced between the scanning strategies. However, the corrosion rate was diminished when a scanning strategy with rotation of 45° was applied. It has been reported that a change of scanning strategy from simply alternating strips to alternating strips with re-melting after each layers decreases segregation degree of Mo and Cr at grains boundaries [35]. The reduction of a Cr-depleted region might improve the corrosion resistance of the L-PBF 316L.
On the contrary, significant attack on grain boundaries and on melt pools of L-PBF specimens for an HD of 30 μm (Fig. 14d) and 40 μm was found. In addition, EBSD analysis of cross sections revealed that this local attack was particularly present at the sites of the sample where finer microstructures were generally found (Fig. 15). The preferential dissolution at grain boundaries has been observed on non-sensitized stainless steel in oxidizing medium such as hot nitric acid [36,37]. In our experimental conditions, the SS is polarized at the beginning of the transpassive domain, in where the Cr2O3-based passive film is dissolved and consequently, grain boundaries are more susceptible to attack by the medium [38,39]. Hence, a higher density of grain boundaries and the formation of non-uniform and less compact oxide layer owing to grain size distribution might enhance the specific reactivity of the surface. Recent studies have demonstrated that this specific reactivity of the grain boundaries could be related to their crystallography nature and their atomic structure, as well as to the segregation of some alloying elements in these areas [38,40]. They have found that high-angle grain boundaries (HAGBs) were more susceptible to intergranular corrosion. It believed that the local re-melting and textured grains, which take place for lower HD (Fig. 8a), could improve the HAGBs formation and consequently, affect the corrosion susceptibility.
Another possibility for explaining this localized corrosion is related to the presence of porosity due to the balling effect when the lowest HD were applied (Fig. 14d) [41]. Porosity was also identified as the main cause of the decreased corrosion resistance of AM materials in different conditions [15,16,42–44]. The pores act as occluded regions where the nitric acid is confined and weakly renewed. Under these conditions, dissolution and reduction products are accumulated catalyzing the HNO3 reduction reaction [20,45]. This autocatalytic phenomenon increases the cathodic current and shifts the corrosion potential toward the transpassive domain. As a result, the passive layer is dissolved and the attack commences down towards inside of the pore. Further investigations should be performed to verify these hypotheses.
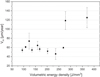 |
Fig. 12 Average corrosion rate (μm/year) of L-PBF 316L specimens as a function of volumetric energy density in 8 mol/L HNO3 at boiling temperature. Error bars represent the standard deviation. |
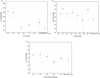 |
Fig. 13 Average corrosion rate of reference 316L SS and L-PBF 316L specimens according to L-PBF parameters a) HD (P, V and scanning strategy fixed), b) power (HD, V and scanning strategy fixed) and c) scanning strategy (P, HD and V fixed) in 8 mol/L HNO3 at boiling temperature. Error bars represent the standard deviation. |
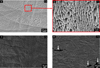 |
Fig. 14 SEM micrographs of surface morphologies of L-PBF specimens after immersion in 8 mol/L HNO3 at boiling temperature for 240 h. Different process parameters are represented: (a) laser power of 80 W (Vm = 61 ± 2 μm/year), (b) shows the attack of equiaxed cells when a laser power of 80W was applied, (c) scanning strategy without rotation (Vm = 54 ± 6 μm/year), (d) HD of 30 μm (Vm = 125 ± 22 μm/year). The white arrows highlighting the presence of pores on the surface. |
 |
Fig. 15 EBSD images of cross sections of L-PBF specimens for an HD of (a) 30 μm and (b) 40 μm after immersion in 8 mol/L HNO3 at boiling temperature for 240 h. |
4 Conclusions
This research was carried out to assess the effect of L-PBF parameters such as laser power, HD and scanning strategy, on the microstructure and corrosion behaviour of 316L stainless steel in nitric acid solution at boiling temperature. The main conclusions of this work can be summarized as follows:
-
The level of porosity and the density of the 316L steel parts manufactured by L-PBF can be optimized by applying the right sets of process parameters. L-PBF specimens with relative density >99% showed almost identical, or in some cases better corrosion properties compared to the cast counterpart samples.
-
The variation of laser power and HD causes a modification of the grain size. Higher power and HD promote the columnar grain growth due to the alteration of thermal gradient at the solid/liquid interface. Cellular size can also be affected by L-PBF parameters, especially laser power.
-
The interiors of cells were preferentially attacked whereas the cell boundaries remain relatively intact due to segregation of elements such as Cr, Ni and Mo when the scanning strategy and the laser power were modified. This corrosion attack involves a slow dissolution of material.
-
HD is a critical parameter on corrosion behaviour of L-PBF 316L SS in nitric acid. High corrosion rates and significant attack on grain boundaries and melt pool were observed for lower HD. Deep attacks were particularly found at the sites of the sample where finer microstructures were present. Porosity and grain size distribution were hypothesised to be responsible for this corrosion behaviour.
Declaration of competing interest
The authors declare that they have no known competing financial interest or personal relationships that could have appeared to influence the work reported in this paper.
Credit author statement
B. Puga: Supervision, Methodology, Investigation, Validation, Visualization, Writing − original draft & Editing. F. Lomello: Supervision, Methodology, Investigation, Validation, Visualization, Writing − original draft & Editing. E. Boussac: Methodology, Investigation, Validation. A. Chniouel: Methodology, Investigation, Validation. A. Fouchereau: Investigation, Validation, Writing − review & editing. P. Laghoutaris: Conceptualization, Project administration, Resources, Funding acquisition, Writing − review & editing. H. Maskrot: Conceptualization, Project administration, Resources, Funding acquisition, Writing − review & editing.
References
- N. Guo, M.C. Leu, Additive manufacturing: technology, applications and research needs, Front. Mech. Eng. 8 , 215–243 (2013) [CrossRef] [Google Scholar]
- A. Chniouel, P.F. Giroux, F. Lomello et al., Influence of substrate temperature on microstructural and mechanical properties of 316L stainless steel consolidated by laser powder bed fusion, Int. J. Adv. Manuf. Technol. 111 , 3489–3503 (2020) [CrossRef] [Google Scholar]
- Y.M. Wang, T. Voisin, J.T. McKeown et al., Additively manufactured hierarchical stainless steels with high strength and ductility, Nat. Mater. 17 , 63–70 (2018) [CrossRef] [PubMed] [Google Scholar]
- P. Bajaj, A. Hariharan, A. Kini et al., Steels in additive manufacturing: a review of their microstructure and properties, Mater. Sci. Eng. A 772, 138633 (2020) [CrossRef] [Google Scholar]
- Y. Zhong, L. Liu, S. Wikman et al., Intragranular cellular segregation network structure strengthening 316L stainless steel prepared by selective laser melting, J. Nucl. Mater. 470 , 170–178 (2016) [CrossRef] [Google Scholar]
- M. Godec, S. Zaefferer, B. Podgornik et al., Quantitative multiscale correlative microstructure analysis of additive manufacturing of stainless steel 316L processed by selective laser melting, Mater. Charact. 160 , 110074 (2020) [CrossRef] [Google Scholar]
- M.H. Farshidianfar, A. Khajepour, A.P. Gerlich, Effect of real-time cooling rate on microstructure in Laser Additive Manufacturing, J. Mater. Process. Technol. 231 , 468–478 (2016) [CrossRef] [Google Scholar]
- T. Voisin, J.B. Forien, A. Perron et al., New insights on cellular structures strengthening mechanisms and thermal stability of an austenitic stainless steel fabricated by laser powder-bed-fusion, Acta Mater. 203 , 116476 (2021) [CrossRef] [Google Scholar]
- G. Sander, J. Tan, P. Balan et al., Corrosion of additively manufactured alloys: a review, Corrosion 74 , 1318–1350 (2018) [CrossRef] [Google Scholar]
- D. Kong, C. Dong, X. Ni et al., Corrosion of metallic materials fabricated by selective laser melting, npj Mater. Degrad. 24 , 1–14 (2019) [Google Scholar]
- C.Y. Yap, C.K. Chua, Z.L. Dong et al., Review of selective laser melting: Materials and applications, Appl. Phys. Rev. 2 , 041101 (2015) [CrossRef] [Google Scholar]
- J.P. Oliveira, A.D. LaLonde, J. Ma, Processing parameters in laser powder bed fusion metal additive manufacturing, Mater. Des. 193 , 108762 (2020) [CrossRef] [Google Scholar]
- D. Kong, C. Dong, S. Wei et al., About metastable cellular structure in additively manufactured austenitic stainless steels, Addit. Manufactur. 30 , 101804 (2021) [CrossRef] [Google Scholar]
- X. Ni, D. Kong, W. Wu et al., Corrosion behavior of 316L stainless steel fabricated by selective laser melting under different scanning speeds, J. Mater. Eng. Perform. 27 , 101007 (2018) [Google Scholar]
- G. Sander, S. Thomas, V. Cruz et al., On the corrosion and metastable pitting characteristics of 316L stainless steel produced by selective laser melting, J. Electrochem. Soc. 164 , 250 (2017) [Google Scholar]
- Y. Sun, A. Moroz, K. Alrbaey, Sliding wear characteristics and corrosion behaviour of selective laser melted 316L stainless steel, J. Mater. Eng. Perform. 23 , 518 (2014) [CrossRef] [Google Scholar]
- Z. Zhang, X. Yuan, Z. Zhao et al., Electrochemical noise comparative study of pitting corrosion of 316L stainless steel fabricated by selective laser melting and wrought, J. Electroanal. Chem. 894 , 115351 (2011) [Google Scholar]
- D.J. Sprouster, W.S. Cunningham, G.P. Halada et al., Dislocation microstructure and its influence on corrosion behavior in laser additively manufactured 316L stainless steel, Addit. Manufactur. 47 , 102263 (2021) [CrossRef] [Google Scholar]
- A.B. Kale, B-K. Kim, D-Ik. Kim et al., An investigation of the corrosion behavior of 316L stainless steel fabricated by SLM and SPS techniques, Mater. Character. 163 , 110204 (2020) [CrossRef] [Google Scholar]
- P. Fauvet, F. Balbaud, R. Robin et al., Corrosion mechanisms of austenitic stainless steels in nitric media used in reprocessing plants, J. Nucl. Mater. 375 , 52–64 (2008) [CrossRef] [Google Scholar]
- H. Fayazfar, M. Salarian, A. Rogalsky et al., A critical review of powder-based additive manufacturing of ferrous alloys: process parameters, microstructure and mechanical properties, Mater. Des. 144 , 98–128 (2018) [CrossRef] [Google Scholar]
- Design and Construction Rules for Mechanical Components of the FBR Nuclear Installations (2007) [Google Scholar]
- A. Spierings, G. Levy, Comparison of density of stainless steel 316L parts produced with Selective Laser Melting using different powder grades, in 20th Annu. Int. Solid Free. Fabr. Symp. SFF 2009 (2009) [Google Scholar]
- S. Ren, P. Li, D. Jiang et al., Removal of metal impurities by controlling columnar grain growth during directional solidification process, Appl. Therm. Eng. 106 , 875–880 (2016) [CrossRef] [Google Scholar]
- L. Beltran-Sanchez, D.M. Stefanescu, A quantitative dendrite growth model and analysis of stability concepts, Metall. Mater. Trans. A 35 , 2471–2485 (2004) [CrossRef] [Google Scholar]
- C. Mutke, K. Geenen, A. Röttger et al., Interaction between laser radiation and metallic powder of 316L austenitic steel during selective laser melting, Mater. Charact. 145 , 337–346 (2018) [CrossRef] [Google Scholar]
- M.L. Montero-Sistiaga, M. Godino-Martinez, K. Boschmans et al., Microstructure evolution of 316L produced by HP-SLM (high power selective laser melting), Addit. Manuf. 23 , 402–410 (2018) [Google Scholar]
- M. Ma, Z. Wang, X. Zeng, A comparison on metallurgical behaviors of 316L stainless steel by selective laser melting and laser cladding deposition, Mater. Sci. Eng. A. 685 , 265–273 (2017) [CrossRef] [Google Scholar]
- Y. Zhong, L. Liu, S. Wikman et al., Intragranular cellular segregation network structure strengthening 316L stainless steel prepared by selective laser melting, J. Nucl. Mater. 470 , 170–178 (2016) [CrossRef] [Google Scholar]
- G. Sander, A.P. Babu, X. Gao et al., On the effect of build orientation and residual stress on the corrosion of 316L stainless steel prepared by selective laser melting, Corros. Sci. 179 , 109149 (2021) [CrossRef] [Google Scholar]
- A.H. Puichaud, C. Flament, A. Chniouel et al., Microstructure and mechanical properties relationship of additively manufactured 316L stainless steel by selective laser melting, EPJ Nucl. Sci. Technol. 5 , 23 (2019) [CrossRef] [EDP Sciences] [Google Scholar]
- G. Wang, Q. Liu, H. Rao et al., Influence of porosity and microstructure on mechanical and corrosion properties of a selectively laser melted stainless steel, J. Alloys Compd. 831 , 154815 (2020) [CrossRef] [Google Scholar]
- D. Kong, C. Dong, X. Ni et al., The passivity of selective laser melted 316L stainless steel, Appl. Surf. Sci. 504 , 144495 (2020) [CrossRef] [Google Scholar]
- J.R. Trelewicz, G.P. Halada, O.K. Donaldson et al., Microstructure and corrosion resistance of laser additively manufactured 316L stainless steel, JOM 68 , 850–859 (2016) [CrossRef] [Google Scholar]
- T. Kurzynowski, K. Gruber, W. Stopyra et al., Correlation between process parameters, microstructure and properties of 316 L stainless steel processed by selective laser melting, Mater. Sci. Eng. A 718 , 64–73 (2018) [CrossRef] [Google Scholar]
- F. Balbaud, G. Sanchez, P. Fauvet et al., Mechanism of corrosion of AISI 304L stainless steel in the presence of nitric acid condensates, Corros. Sci. 42 , 1685–1707 (2000) [CrossRef] [Google Scholar]
- V. Bague, S. Chachoua, Q.T. Tran et al., Determination of the long-term intergranular corrosion rate of stainless steel in concentrated nitric acid, J. Nucl. Mater. 392 , 396–404 (2009) [CrossRef] [Google Scholar]
- B. Gwinner, M. Auroy, F. Balbaud-Célérier et al., Towards a reliable determination of the intergranular corrosion rateof austenitic stainless steel in oxidizing media, Corros. Sci. 107 , 60–75 (2016) [CrossRef] [Google Scholar]
- E. Tcharkhtchi-Gillard, M. Benoit, P. Clavier et al., Kinetics of the oxidation of stainless steel in hot and concentrated nitric acid in the passive and transpassive domains, Corros. Sci. 107 , 182–192 (2016) [CrossRef] [Google Scholar]
- M. Shimada, H. Kokawa, Z.J. Wang et al., Optimization of grain boundary character distribution for intergranular corrosion resistant 304 stainless steel by twin-induced grain boundary engineering, Acta Mater. 50 , 2331–2341 (2002) [CrossRef] [Google Scholar]
- R. Li, Y. Shi, Z. Wang et al., Densification behaviour of gas and water atomized 316L stainless steel powder during selective laser melting, Appl. Surf. Sci. 256 , 4350–4356 (2010) [CrossRef] [Google Scholar]
- E. Otero, A. Pardo, M.V. Utrilla et al., Corrosion behaviour of AISI 304L and 316L stainless steels prepared by powder metallurgy in the presence of sulphuric and phosphoric acid, Corros. Sci. 40 , 1421–1434 (1998) [CrossRef] [Google Scholar]
- R.F. Schaller, J.M. Taylor, J. Rodelas et al., Corrosion properties of powder bed fusion additively manufactured 17–4 PH stainless steel, Corros. Sci. 73 , 796 (2017) [CrossRef] [Google Scholar]
- M. Laleh, A.E. Hughes, S. Yang et al., Two and three-dimensional characterisation of localised corrosion affected by lack-of-fusion pores in 316L stainless steel produced by selective laser melting, Corros. Sci. 165 , 108394 (2020) [CrossRef] [Google Scholar]
- J. Pellé, N. Gruet, B. Gwinner et al., On the role of Fe(III) ions on the reduction mechanisms of concentrated nitric acid, Electrochim. Acta 335 , 135578 (2020) [CrossRef] [Google Scholar]
Cite this article as: Beatriz Puga, Fernando Lomello, Emeline Boussac, Aziz Chniouel, Alexis Fouchereau, Pierre Laghoutaris, Hicham Maskrot, Influence of laser powder bed fusion processing parameters on corrosion behaviour of 316L stainless steel in nitric acid, Metall. Res. Technol. 119, 523 (2022)
All Tables
All Figures
|
Fig. 1 SEM micrograph of the raw 316L SS powder showing the spherical particles. |
| In the text | |
|
Fig. 2 Schematic of the laser scanning strategy for two consecutive layers (n and n + 1) showing the 90° rotation between each island. |
| In the text | |
|
Fig. 3 X-ray diffraction Ɵ-2Ɵ scan of the 316L SS Trumpf powder showing the first five (hkl) peaks of the pure austenitic phase (▪). |
| In the text | |
|
Fig. 4 Density of the parts produced by L-PBF as a function of the volumetric energy density (J/mm3). |
| In the text | |
|
Fig. 5 Optical micrographs at different magnification of parts produced by L-PBF as a function of the volumetric energy density: (a) 101 J/mm3 and (b) 202 J/mm3. |
| In the text | |
|
Fig. 6 Grain size according to L-PBF parameters (a) laser power (V and HD fixed) and (b) HD (P and V fixed). |
| In the text | |
|
Fig. 7 EBSD images showing the grain size for (a) Ev = 370 J/mm3 (HD = 30 μm) and (b) Ev =123 J/mm3 (HD = 90 μm). |
| In the text | |
|
Fig. 8 Optical Micrographs illustrating the overlap of the melt pools for (a) Ev = 370 J/mm3 (HD = 30 μm) and (b) Ev = 123 J/mm3 (HD = 90 μm). |
| In the text | |
|
Fig. 9 Average cells size according to L-PBF parameters (a) laser power (V and HD fixed) and (b) HD (P and V fixed). |
| In the text | |
|
Fig. 10 Pole figure <110> along the Z direction (a) Ev = 123 J/mm3 and b) Ev = 340 J/mm3. |
| In the text | |
|
Fig. 11 Texture intensity along <110> as a function of the volumetric energy density (J mm−3). |
| In the text | |
|
Fig. 12 Average corrosion rate (μm/year) of L-PBF 316L specimens as a function of volumetric energy density in 8 mol/L HNO3 at boiling temperature. Error bars represent the standard deviation. |
| In the text | |
|
Fig. 13 Average corrosion rate of reference 316L SS and L-PBF 316L specimens according to L-PBF parameters a) HD (P, V and scanning strategy fixed), b) power (HD, V and scanning strategy fixed) and c) scanning strategy (P, HD and V fixed) in 8 mol/L HNO3 at boiling temperature. Error bars represent the standard deviation. |
| In the text | |
|
Fig. 14 SEM micrographs of surface morphologies of L-PBF specimens after immersion in 8 mol/L HNO3 at boiling temperature for 240 h. Different process parameters are represented: (a) laser power of 80 W (Vm = 61 ± 2 μm/year), (b) shows the attack of equiaxed cells when a laser power of 80W was applied, (c) scanning strategy without rotation (Vm = 54 ± 6 μm/year), (d) HD of 30 μm (Vm = 125 ± 22 μm/year). The white arrows highlighting the presence of pores on the surface. |
| In the text | |
|
Fig. 15 EBSD images of cross sections of L-PBF specimens for an HD of (a) 30 μm and (b) 40 μm after immersion in 8 mol/L HNO3 at boiling temperature for 240 h. |
| In the text | |
Current usage metrics show cumulative count of Article Views (full-text article views including HTML views, PDF and ePub downloads, according to the available data) and Abstracts Views on Vision4Press platform.
Data correspond to usage on the plateform after 2015. The current usage metrics is available 48-96 hours after online publication and is updated daily on week days.
Initial download of the metrics may take a while.