| Issue |
Metall. Res. Technol.
Volume 116, Number 5, 2019
Inclusion cleanliness in the metallic alloys
|
|
|---|---|---|
| Article Number | 517 | |
| Number of page(s) | 6 | |
| DOI | https://doi.org/10.1051/metal/2019028 | |
| Published online | 17 September 2019 | |
Regular Article
An experimental study of the inclusion behavior during maraging steel processing
1
Institut Jean Lamour, UMR CNRS 7198, LabEx DAMAS, université de Lorraine,
2, allée André-Guinier, Campus Artem,
54000
Nancy, France
2
Aperam Imphy Alloys,
avenue Jean-Jaurès,
58160
Imphy, France
* e-mail: This email address is being protected from spambots. You need JavaScript enabled to view it.
Received:
30
November
2018
Accepted:
24
May
2019
Abstract
Two maraging steel rods with different sulfur content, deliberately seeded with alumina (Al2O3) inclusions, were remelted in an electron beam furnace. The aim was on one hand to highlight the emergence of non-metallic inclusions at the liquid metal surface and on the other hand to study the effect of the presence of a surface active element (sulfur) on their behavior. The in situ real time observation of Al2O3 clusters was possible using both high-speed video and infrared thermography. The inclusions emerge and tend to collide and quickly agglomerate into rafts. A semi-quantitative analysis confirmed that almost 100% of inclusions are captured at the free surface. The electron beam creates large thermal gradients in the impingement zones; this induces thermocapillary convection (Marangoni effect). The flow direction depends on the sulfur content. This tendency was well-observed by following the trajectories of inclusion rafts.
Key words: inclusion cleanliness / non-metallic inclusions / agglomeration / Marangoni convection
© R. Bhar et al., published by EDP Sciences, 2019
 This is an Open Access article distributed under the terms of the Creative Commons Attribution License (http://creativecommons.org/licenses/by/4.0/), which permits unrestricted use, distribution, and reproduction in any medium, provided the original work is properly cited.
Nomenclature
Di: Inclusion equivalent diameter [μm]
NAi: Inclusion area density in the metal base [1/mm2]
NVi: Inclusion volume density in the metal base [1/mm3]
ξB: Inclusion area fraction in the metal base [−]
ξLF: Inclusion area fraction at the liquid metal film surface [−]
ξLD: Inclusion area fraction at the liquid metal drop surface [−]
ΦB: Inclusion volume fraction in the metal base [−]
ΦL: Inclusion volume fraction in the liquid metal [−]
Ar: Area occupied by the inclusion rafts [mm2]
d: Droplet diameter [mm]
Ad: Droplet area [mm2]
Vd: Droplet volume [mm3]
1 Introduction
The inclusion cleanliness of alloys has been for decades a major concern for the metallurgists, in particular the producers of special steels, so that much industrial effort was directed towards enhancing the inclusion removal. Numerous refining processes have appeared in order to improve the mechanical properties of steel. As examples, the VAR (vacuum arc remelting), ESR (electron slag remelting) and EBM (electron beam melting) processes enable one to obtain ingots with a high chemical homogeneity and inclusion cleanliness. The non-metallic inclusions have an adverse influence on the fatigue resistance of steels. Their presence promotes a discontinuity in the physicochemical properties of the metallic matrix. This results in important stress concentration which could lead to the rupture of alloy during fatigue cycles. This is the reason why the inclusion cleanliness remains crucial. Many studies have been conducted dealing with the inclusion behavior in the molten steel. The emersion phenomena as well as collision and agglomeration mechanisms of non-metallic inclusions have been extensively studied experimentally [1–8]. These mechanisms were widely explored in many industrial processes during steelmaking, for instance, gas bubbling, nozzle clogging, deoxidation, reoxidation… However, a detailed in-situ observation of the emersion of inclusions in liquid metal treatment has never been performed during the transfer of metal caused by the fall of liquid drops, as we can find in remelting processes for the production of maraging steels. The present study aims to achieve such observation.
The agglomeration mechanism is attributed to the long-range attraction capillary forces. The emersion phenomena depends on the wettability of the particles by the steel, which is related to the composition and structure of inclusions [9].
The non-metallic inclusions which are not wettable are CaO, Al2O3, MgO, ZrO2 and Ce2O3. Their contact angle is higher than 90°, thus they are captured by the steel melt at the free surface and tend to aggregate. However, other inclusions are wettable and therefore do not aggregate. This is particularly the case of silica and silicates, TiO2 and Cr2O3 for example [10].
In the present paper, the in situ observation of inclusion behavior in a liquid steel melt with either a low or high sulfur content was performed during electron beam melting sequences.
To achieve this goal, electron beam remelting of steel samples with high Al2O3 concentration and different sulfur content was performed in an EB furnace in the drip-melting configuration (section 2.3).
The visualization of the inclusion behavior was carried out using high-speed video and infrared thermography thanks to stroboscopic viewports. Moreover, the effect of the sulfur content on thermocapillary convection (i.e., Marangoni convection) was clearly observable during the experiments. Several publications deal with the effect of surface-active agents on the surface tension driven flow [11]. Some researchers have turned their attention to this phenomenon in weld pool for example [12,13].
2 Experimental
2.1 Composition of the samples
The very low volume fraction of inclusions in industrial ingots (lower than 1 ppm) and their small size (a few μm) make the observation difficult during melting. In order to easily visualize inclusions during EB remelting, it was found necessary to artificially increase the inclusion content of the alloy. The amount of sulfur was also suspected to play a role. Therefore, two specific maraging steel samples (cylindrical rods) with different sulfur content were processed for this study by Aperam Alloys Imphy with a laboratory VIM furnace. FeO was added in the liquid metal before the deoxidation step. After dissolution, the molten metal held about 200 ppm of dissolved oxygen. The alloy was then completely deoxidized by aluminum, forming a large amount of aluminum oxides. Both ingots were forged successfully into several rods of diameter 45 mm and length 500 mm. The chemical composition of the two maraging steel samples is outlined in Table 1. We point out that the sulfur content in the second sample is ten times higher than in the first one.
Chemical composition of the two maraging steel samples.
2.2 Inclusion characterization
The characterization of inclusions was performed using a scanning electron microscope (SEM) equipped with energy-dispersive X-ray spectroscopy (EDS) on some polished cross-section specimen of the rods. Such analyses provide quantitative information about the size and chemical nature of the inclusions.
The results of the quantitative EDS analysis are reported in Table 2. The atomic concentration of each element present in the inclusion was determined. As it can been seen, the inclusions are mainly constituted of aluminum and oxygen and their proportion (2/5 Al, 3/5 O) corresponds to the Al2O3 phase.
Furthermore, these alumina inclusions are easily recognizable by their shape (Fig. 1).
The size distribution of the inclusions was determined by automatically measuring the size of collected inclusions in a pre-defined area on a cross-section specimen of the samples (Fig. 2).
Typical inclusion size is 2 μm, ranging between 1 and 5 μm. The distribution will help us to quantify the fraction of inclusions which are trapped at the steel melt free surface (section 3.2).
Using the measured size distribution of inclusions (Fig. 2), it is possible to calculate the total area fraction of the inclusions in a cross-sectional plane of a rod. From the area density and the equivalent diameter, the total area fraction of the inclusion population is defined by:
 (1)
(1)
The values obtained are reported in Table 3.
Fullman established, in 1953, the mathematical formula enabling to estimate the volume density  of aggregated spherical particles from their area density
  and their mean diameter Di [14].
 (2)
(2)
Then, we deduce the volume fraction ΦB of inclusions.
 (3)
(3)
The values obtained for the two samples are reported in the Table 4.
The quantitative difference in inclusion volume fraction between the two samples is not caused by their different S contents, as the inclusion chemistry is similar. It is probably related to a variation in the deoxidation procedure while processing the samples.
Chemical composition of the inclusions obtained by EDX.
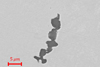 |
Fig. 1 Alumina inclusions observed with SEM. |
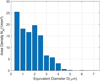 |
Fig. 2 Size distribution of alumina inclusions in sample 2. |
Total inclusion area fraction for the two samples.
Total inclusion volume fraction for the two samples.
2.3 Electron beam melting experiment
The drip-melting configuration is schematically presented in Fig. 3. The apparatus includes a vacuum chamber (with a pressure lower than 10−3 mbar), an electron beam gun with an accelerating voltage ranged between 25 and 40 kV and a horizontal feeder.
This furnace uses the high-energy electron beam as a heat source with the aim of melting the sample which is horizontally positioned. The generated droplets fall in a water-cooled copper crucible. Finally, the uniform distribution of energy is ensured by magnetic lenses which force the beam to describe well-defined patterns (lines, circles, ellipses…).
The operating parameters used in the present drip-melting test are 40 kV voltage and 0.5 A current. The resulting melting rate is approximately 1.5 kg/h. The films are recorded by a high definition video camera (Sony FX1000E) as well as an infrared camera (ThermaCAM SC300-FLIR).
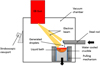 |
Fig. 3 Schematic diagram of the EB furnace (drip-melting configuration). |
3 Results
3.1 Experimental observation
By analyzing the recorded video frame by frame, the inclusion behavior in the molten steel can be observed. A snapshot of a typical visualization through the viewport of the furnace is given in Fig. 4.
After the start of melting, a thin steel liquid film forms and supplies the protuberance generated at the bottom of the rod. The pendant drop evolves into a spherical shape and remains attached by a trailing filament before breaking up into satellite drops. Then, the drop falls into the liquid pool.
Many alumina particles emerge from the molten steel and float on the surface. The inclusions collide and coalesce instantly into millimeter-sized rafts dragged by the fluid flow (Fig. 5).
The effect of the sulfur content on the behavior of inclusion is observable thanks to the rafts playing the role of tracers for the thermocapillary fluid flow convection.
In a “normal” steel (low sulfur content), under the influence of the thermal power provided by the electron beam, the cluster of inclusions is fractured. The high temperature gradient creates a gradient of surface tension. The inclusions are trapped by the surface tension driven flow (Marangoni convection); the fluid moves from the hot zones to the cold ones dragging the particles which conducts to the dispersion and breakup of the raft marked in Figure 6 with a red circle.
On the contrary, with a higher sulfur content, Marangoni convection is reversed. The inclusions are concentrated in the EB impingement zone leading to a fast and uneven growth of rafts as it can be observed on Figure 7.
As we can see, under the impingement of the beam, the raft fragmentation in the low sulfur content sample (Fig. 6) is quicker than the continuous aggregation of alumina particles in the high sulfur content sample (Fig. 7).
This tendency is also easily observable at the liquid pool free surface, where an important fraction of inclusions is floating and form rafts. The scanning patterns of the electron beam are represented by red dashed lines (Fig. 8). In this zone of sample 1, the inclusions are almost inexistent; the particles are maintained out of reach of the beam due to the Marangoni convection flow.
However, when the sulfur content is higher, the inclusions remain agglomerated in the center of the bath. The large circle scanned by the electron beam concentrates the inclusions into a raft at the center of the top surface (Fig. 9).
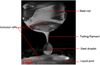 |
Fig. 4 Liquid steel drop before detachment. |
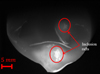 |
Fig. 5 Large alumina inclusion rafts on the melt surface. |
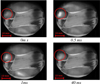 |
Fig. 6 Fracture of alumina aggregates (sample 1: low sulfur content). |
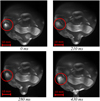 |
Fig. 7 Agglomeration of alumina particles (sample 2: high sulfur content). |
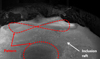 |
Fig. 8 Liquid bath in the case of a low sulfur content (sample 1), also showing the EB patterns. |
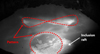 |
Fig. 9 Liquid bath in the case of a high sulfur content (sample 2), also showing the EB patterns. |
3.2 Semi-quantitative analysis
The purpose of the semi-quantitative analysis is to assess the important emersion of inclusions.
3.2.1 Inclusion area fraction at the free surfaces
We shall first estimate the area fraction of the inclusions rafts (ξLF) in the liquid film. This estimation was easier with the high sulfur content sample (sample 2) because the rafts remain agglomerated as we can see in Figure 10 (shiny areas).
The area occupied by the rafts was estimated on snapshots and divided by the cross-sectioned area of the rod whose diameter is 45 mm. The order of magnitude of the area fraction ξLF found is around 1%, which represents roughly 50 times the value calculated in the metal base ξB (Table 3). This first comparison already shows that an important fraction of inclusions emerged and is captured at the free surface.
Thanks to IR thermal imaging, the aggregates are more easily visible at the surface of drops. Alumina inclusions are refractory particles, with a higher emissivity than the liquid metal, which makes them directly perceptible. The surface temperature map of the liquid metal obtained by infrared thermography is shown in Figure 11. A raft of inclusions is clearly apparent at the surface of the drop (dark orange colored).
The inclusion area fraction on the surface of the drops can be estimated.
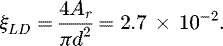 (4)
(4)
The same order of magnitude was found than at the liquid metal film surface (ξLF ∼ 1.0 × 10⁻²).
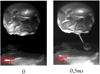 |
Fig. 10 Visualization of the rafts on the molten steel surface (sample 2). |
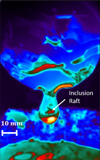 |
Fig. 11 Typical IR frame during melting (sample 2). |
3.2.2 Inclusion volume fraction and raft thickness
Here, we assume that the volume fraction in the droplet is equal to the base metal one. From Table 4,
 (5)
(5)
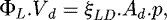
Now, let us suppose that all inclusions are captured at the free surface of the liquid film and drops. We are then able to estimate the average raft thickness, based on the volume fraction of inclusion in drops. Assuming that p represents that thickness, Vd and Ad respectively the volume and area of a spherical droplet having a diameter d of 10 mm, as well as ξLD the area fraction estimated previously from the observation of the frames, we get:
hence,
 (6)
(6)
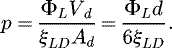 (7)
(7)
This formula gives an estimation of the raft thickness which equals 8 μm. Since such a thickness corresponds to only a few individual inclusions, the assumption of the total dewetting of inclusions is plausible.
4 Conclusion
The inclusion behavior in a seeded maraging steel was in-situ observed during electron beam remelting experiments in the drip-melting configuration. The alumina inclusions exhibited the well-known emersion and aggregate clustering behavior in molten steel melts. The inclusions formed rafts, whose size reaches some millimeters, trapped by the fluid flow.
A semi-quantitative analysis suggests that all inclusions were captured at the free surface. This behavior is attributed to the low wettability of alumina inclusions by molten steel as well as to the long-range attraction between each other. These mechanisms can be exploited in industrial processes in order to optimize the inclusion removal.
Local surface temperature gradients in the impingement zones of the electron beam lead to surface tension gradients. These gradients induced thermocapillary convection (Marangoni convention) which is reversed in presence of sulfur. In a low sulfur content sample, the liquid steel moves from the hot zones to the cold ones, which conduct the alumina aggregates to fracture and disperse. In contrast, in the case of a high sulfur content, the fluid flow is reversed leading to a fluid motion from the cold zones to the hot ones.
References
- H. Yin, H. Shibata, T. Emi, M. Suzuki, Characteristics of agglomeration of various inclusion particles on molten steel surface, ISIJ Int. 37, 946–955 (1997) [CrossRef] [Google Scholar]
- W. Mu, N. Dogan, K.S. Coley, Agglomeration of non-metallic inclusions at the steel/Ar interface: model application, Metall. Mater. Trans. 48B, 2093–2103 (2017) [Google Scholar]
- H. Shibata, H. Yin, T. Emi, The capillary effect promoting collision and agglomeration of inclusion particles at the inert gaz-steel interface, Philos. Trans. Royal Soc. A 352, 957–966 (1998) [CrossRef] [Google Scholar]
- C.G. Aneziris, C. Schroeder, M. Emmel, G. Schmidt, H.P. Heller, H. Berek, In situ observation of collision between exogenous and endogenous inclusions on steel melts for active steel filtration, Metall. Mater. Trans. B 44, 954–968 (2013) [CrossRef] [Google Scholar]
- H. Yin, H. Shibata, T. Emi, M. Suzuki, In situ observation of collisions, agglomeration and cluster formation of alumina inclusion particles on steel melts, ISIJ Int. 37, 936–945 (1997) [CrossRef] [Google Scholar]
- X. Changji, Wettability and agglomeration characteristics of non-metallic inclusions, PhD thesis, 2016 [Google Scholar]
- H. Tozaway, Y. Kato, K. Sorimach, T. Nakanish, Agglomeration and flotation of alumina clusters in molten steel, ISIJ Int. 39, 426–434 (1999) [CrossRef] [Google Scholar]
- P. Yan, M. Guo, B. Blanpain, In situ observation of the formation and interaction behavior of the oxide/oxysulfide inclusions on a liquid iron surface, Metall. Mater. Trans. B 45, 903–913 (2014) [CrossRef] [Google Scholar]
- P. Kozakevitch, L.D. Lucas, Rôle des phénomènes de surface dans l’élimination d’inclusions solides d’un bain métallique, Rev. Metall. 65, 589–598 (1968) [CrossRef] [Google Scholar]
- J. Pokorny, A. Pokorny, Inclusions non métalliques dans l’acier, Techniques de l’Ingénieur 2(M220), 1998. [Google Scholar]
- S. Kimura, Y. Nabeshima, K. Nakajima, S. Mizoguchi, Behavior of nonmetallic inclusions in front of the solid-liquid interface in low-carbon steels, Metall. Mater. Trans. 31, 1013–1021 (2000) [CrossRef] [Google Scholar]
- C.R. Heiple, J.R. Roper, Mechanism for minor element effect on GTA fusion zone geometry, Welding Res. 61, 97–102 (1982) [Google Scholar]
- C. Limmaneevichitr, S. Kou, Visualization of marangoni convection in simulated weld pools containing a surface active agent, Welding J. 39, 324–330 (2000) [Google Scholar]
- F.N. Rhines, R.T. DeHoff Quantitative microscopy, New York, McGraw-Hill Book Company, 1968 [Google Scholar]
Cite this article as: Rayan Bhar, Julien Jourdan, Vincent Descotes, Alain Jardy, An experimental study of the inclusion behavior during maraging steel processing, Metall. Res. Technol. 116, 517 (2019)
All Tables
All Figures
|
Fig. 1 Alumina inclusions observed with SEM. |
| In the text | |
|
Fig. 2 Size distribution of alumina inclusions in sample 2. |
| In the text | |
|
Fig. 3 Schematic diagram of the EB furnace (drip-melting configuration). |
| In the text | |
|
Fig. 4 Liquid steel drop before detachment. |
| In the text | |
|
Fig. 5 Large alumina inclusion rafts on the melt surface. |
| In the text | |
|
Fig. 6 Fracture of alumina aggregates (sample 1: low sulfur content). |
| In the text | |
|
Fig. 7 Agglomeration of alumina particles (sample 2: high sulfur content). |
| In the text | |
|
Fig. 8 Liquid bath in the case of a low sulfur content (sample 1), also showing the EB patterns. |
| In the text | |
|
Fig. 9 Liquid bath in the case of a high sulfur content (sample 2), also showing the EB patterns. |
| In the text | |
|
Fig. 10 Visualization of the rafts on the molten steel surface (sample 2). |
| In the text | |
|
Fig. 11 Typical IR frame during melting (sample 2). |
| In the text | |
Current usage metrics show cumulative count of Article Views (full-text article views including HTML views, PDF and ePub downloads, according to the available data) and Abstracts Views on Vision4Press platform.
Data correspond to usage on the plateform after 2015. The current usage metrics is available 48-96 hours after online publication and is updated daily on week days.
Initial download of the metrics may take a while.